Annexes
Annex I – Core business statistics
Key performance indicators (KPIs)
Priority: Finalising the Basel III implementation in the EU
KPI
| Indicator | Weight | Short description | Target | Achievement | |
|---|---|---|---|---|---|
| A | Number of technical standards, guidelines, reports delivered | 100% | Number of technical standards, guidelines and reports delivered on time stemming from implementation of the CRD6 / CRR3 / BRRD3 | 80% | 82% |
Source of information KPI A: EBA work programme monitoring tool and annual report.
In relation to KPI A the EBA delivered 29 technical standards, guidelines and reports compared to 41 indicated as planned in the 2023 work programme. While some items had to be postponed, delayed or cancelled for various, valid reasons – often outside of the EBA’s control - the tables in section 1.4. show 24 additional deliverables for activities 1-6 and 11, which brings the achievement rate to 82%.
Priority: Running an enhanced EU-wide stress test
KPI
| Indicator | Weight | Short description | Target | Achievements | |
|---|---|---|---|---|---|
| A | Validation of ECB Net Fee and Commission Income (NFCI) and Net Interest Income (NII) models | 25% | NFCI and NII to be validated by EBA and NCAs for possible use as top-down in 2023 stress test | 100% | 100% |
| B | Publication of Stress Test results | 75% | Covers running actual stress test, methodological updates and publication of results | 100% | 100% |
Source of information KPI A, KPI B: EBA work programme monitoring tool and publications
Regarding the KPIs, the following should be noted:
KPI A: Validation of ECB Net Fee and Commission Income (NFCI) and Net Interest Income (NII) projections for use as top-down models for possible use as top-down in the 2023 stress test took place in February 2023.
KPI B: The 2023 EU-wide stress test was run from January 2023, with results published in July 2023.
Priority: Putting data at the service of stakeholders
KPI
| Indicator | Weight | Short description | Target | Achievements | |
|---|---|---|---|---|---|
| A | Launch of dissemination portal | 40% | Project to develop infrastructure for dissemination of data and analysis also in light of preparing for the Pillar 3 data hub | 100% | 100% |
| B | Data Point Model ReFit | 30% | Implementation of new improved Data Point Model | 100% | 100% Developed but implemented in 2024-2025 |
| C | Digital Regulatory Reporting (DRR) tools | 30% | Completion of first phase of new DRR tools to support efficient creation and maintenance of the data dictionary related with reporting requirements (data modelling, validations and transformations, the data exchange formats generation) | 100% | 100%. |
Source of information KPI A: launch of the portal for use by EBA users and competent authorities; KPI B: Publication of DPM 2.0 standard in June and publication of implementation plan in October 2023; KPI C: Launch of DPM studio late 2023.
Regarding the KPIs, the following should be noted.
KPI A: EDAP was launched for internal users and competent authorities in 2023.
KPI B: DPM 2.0 standard was launched in H1 2023. Implementation started in 2023 by launching a DPM quality review. The EBA will issue technical packages with DPM 2.0 starting from H2 2024, with transitional use until the end of 2025.
KPI C: The first version of the DPM Studio tool was launched in 2023.
Priority: Delivering on digital finance and MiCAR/DORA mandates
KPIs
| Indicator | Weight | Short description | Target | Achievements | |
|---|---|---|---|---|---|
| A | Percentage of mandates under MiCA to be submitted to the EC in 2024 and to be consulted on in 2023 | 35% | Under current assumption, EBA will be mandated to deliver to the EC approx 20. TS and GLs in 2024. | 100% | 95% All but one CPs were delivered in 2023. |
| B | Percentage of mandates under DORA published and submitted to the EC in 2023 | 35% | Under current assumption, DORA will confer 13 TS and GLs joint mandates on the ESAs, of which 5 are to be delivered in 2023 | 100% | 100% All CPs / final products were delivered as planned |
| C | Operational readiness to take up new tasks in relation to DORA and MiCA | 10 % | The EBA may be given new tasks as part of the DORA and MiCA proposals and should be ready to take up tasks (supervision/oversight and etc.) effectively and efficiently | EBA is implementing operational readiness plan | Implementation of operational readiness plan on track |
| D | Number of thematic publications, incl. opinions or reports provided to the EC and NCAs to build knowledge, promote convergence, and identify regulatory gaps or obstacles relating to financial innovation | 10% | The EBA has a mandate to monitor Innovations and regularly issues recommendations to NCAs and/or the EC | Up to 2 thematic publications (opinions or reports) | Achieved 2 publications |
| E | Percentage of reviewed and quality verified training curriculum of the Digital Finance Academy’s to ensure it is tailored to the competent authorities’ needs | 10% | The EBA, together with ESMA and EIOPA, will guide and steer development of the Academy’s training curriculum to ensure it is tailored to the competent authorities’ needs | 100% | 100% |
Source of information: KPI A, B: and D: EBA work programme monitoring tool and publications, KPI C: DORA /MiCAR milestones tracker, .KPI E: Internal ESA report to DG Reform.
Regarding the KPIs, the following should be noted.
KPI A: for the 20 mandates for technical standards and guidelines the EBA delivered consultation papers in accordance with the planning – as revised to reflect the later-than-expected finalisation of MiCAR – with only one mandate having been postponed to the extent that the initial timeline was indicative (as MiCAR had not yet been finalised) and had to be reviewed and agreed between the ESAs. This amounts to an achievement rate of 95%.
KPI B: for the 13 mandates for technical standards and guidelines the EBA delivered in accordance with the planning 4 final draft RTS, 4 CPs for draft RTS, 1 final draft ITS, 1 CP for draft ITS and 2 CPs for draft guidelines. This amounts to an achievement rate of 100%.
KPI C: in respect of the operational readiness to take up tasks (supervision/oversight etc.) effectively and efficiently the implementation of the plan is fully on track.
KPI D: the EBA published in 2023 the report on the stocktake on BigTech direct financial services provision in the EU[1] and the joint ESAs report on innovation facilitators[2].
KPI E: review and quality verification of training curriculum of the SDFA has been completed in accordance with the SLA.
Priority: Enhancing capacity to fight money laundering and terrorist financing in the EU
KPIs
| Indicator | Weight | Short description | Target | Achievements | |
|---|---|---|---|---|---|
| C | Capacity to identify, analyse and disseminate information on ML/TF risks | 25% | EBA will identify, assess and disseminate information about ML/TF risks based on, inter alia, information from the European reporting System for material CFT/AML weaknesses (EuReCA). EBA will also publish the 4th Opinion on ML/TF risk under Art 6(5) of the AMLD | Analysis and dissemination of information in EuReCA, ad hoc and upon reasoned request 1 opinion | Achieved 2 opinions
|
| D | Contributing to the implemen-tation of a holistic approach to tackling financial crime | 25% | EBA will deliver mandates under the 2022 Fund Transfers Regulation. It will also continue its work on de-risking and access to the financial system | Up to 4 guidelines or amendments to existing guidelines | Achieved
|
| E | Effective AML/CFT supervision – number of implementation and thematic reviews | 30% | EBA will assess competent authorities’ approaches to AML/CFT supervision, with bilateral feedback and action points. It will also monitor AML/CFT colleges | 1 thematic review; up to 4 implementation reviews | Achieved
|
| F | Preparing for the smooth transfer of powers to AMLA | 20% | EBA will prepare to hand over those aspects of its work that relate exclusively to AML/CFT and that will fall within AMLA’s remit | Transition plan | Execution of plan on track |
Source of information: KPIs C, D and E: EBA work programme monitoring tool and publications; KPI F: internal project plan.
Regarding the KPIs, the following should be noted.
KPI C: to support its capacity to identify, analyse and disseminate information on ML/TF risks the EBA published its fourth Opinion on money laundering and terrorist financing risks across the EU[3] and its third staff-led review of competent authorities’ approaches to tackling money laundering and terrorist financing (ML/TF) risks in the banking sector[4].
KPI D: in terms of its contribution to the implementation of a holistic approach to tackling financial crime, the EBA delivered, in accordance with the planning mandates under the 2022 Fund Transfers Regulation, two final sets of guidelines and two CPs for draft guidelines, and as part of its work on de-risking one final set of guidelines and an amendment to existing guidelines. This amounts to an achievement rate of 100%.
KPI E: as part of efforts to achieve effective AML/CFT supervision the EBA published: a report on money laundering and terrorist financing (ML/TF) risks associated with EU payment institutions[5] and also its third report on the functioning of anti-money laundering and countering the financing of terrorism (AML/CFT) colleges[6] which covers the thematic review; as well as the third staff-led implementation report and implementation reviews of 11 CAs in 5 MS as part of the fourth and final round.
KPI F: the execution of the project plan to prepare for the smooth transfer of powers to AMLA is on track (see section 1.1.5 for further details).
Priority: Implementing the environmental, social and governance (ESG) roadmap
KPIs
| Indicator | Weight | Short description | Target | Achievement | |
|---|---|---|---|---|---|
| A | Contribution to the Renewed Sustainable Finance Strategy | 60% | Number of ESG related technical standards, GL, reports and responses to CfA stemming from the mandates in the CRD, CRR, IFD, IFR and from the renewed Sustainable Finance Strategy of the EC delivered on time | 80% | 86% 7 mandates delivered in 2023, of which one with delay |
| B | Implementation of one-off fit-for-55 climate risk scenario analysis | 40% | Preliminary work on the one-off fit-for-55 climate risk scenario analysis in accordance with the renewed Sustainable Finance Strategy of the EC | Development of climate one-off fit-for-55 climate risk scenario analysis | Data collection launched in December 2023 |
Source of information: KPI A and KPI B: EBA work programme monitoring tool and publications.
NB: KPI B was adopted after the finalisation of the 2023 Work programme.
Regarding the KPIs, the following should be noted.
- KPI A: the EBA delivered seven ESG-related mandates. Only one of the reports was indicated in the 2023 planning, the remaining deliverables were either based on the newly proposed draft mandates, or requested by the Commission later. The mandates delivered in 2023 included one final draft RTS developed jointly with ESMA and EIOPA , one draft set of guidelines, two reports and two responses to Calls for Advice from the Commission. Most of the products were delivered within the requested timelines; only one joint final draft RTS was delivered after the deadline, which was due to controversies related to the issues covered by the RTS.
- KPI B: the implementation of the one-off Fit-for-55 climate risk scenario analysis is on track, with the data collection launched in December 2023.
Annex II – Budgetary and financial management
Revenue
The EBA Founding Regulation stipulates that the revenues of the Authority shall consist, in particular, of:
- obligatory contributions from national public authorities competent for the supervision of financial institutions;
- a subsidy from the European Union;
- any fees paid to the Authority in the cases specified in the relevant instruments of the Union law.
Furthermore, Article 20 of the Financial Regulation enables the EBA to collect other external and internal assigned revenue used to finance specific items of expenditure.
Comparison of revenues received in 2023 vs 2022
| Revenues | 2023 A | 2022 B | 2023 vs 2022 | |
|---|---|---|---|---|
EUR C = A – B | % D = C / B | |||
| EU Contribution | 19 428 306 | 18 685 999 | 742 307 | 4.0 |
| Contributions from NCAs | 32 453 924 | 31 054 015 | 1 399 909 | 4.5 |
| 31 479 332 | 30 121 462 | 1 357 870 | 4.5 |
| 974 592 | 932 553 | 42 039 | 4.5 |
| Contributions from host Member State | 575 000 | 575 000 | - | 0.0 |
| DG REFORM funding for EU SDFA | 214 772 | 44 682 | 170 090 | 380.7 |
| Miscellaneous revenues | 401 041 | 737 110 | - 336 069 | - 45.6 |
| TOTAL REVENUES | 53 073 043 | 51 096 806 | 1 976 237 | 3.9 |
Expenditure
In 2023, the EBA reached a budget execution rate of 97.4% (or EUR 51 683 951) on all revenues received. The budget execution was impacted by having a lower-than-planned number of temporary and contract agents, a lower number of guidelines being sent for translation than had been planned for, and several IT projects that were either cancelled or postponed to 2024.
Comparison of total appropriations committed at the end of the year in 2023 vs 2022
| Title | 2023 A | 2022 B | 2023 vs 2022 | |
|---|---|---|---|---|
EUR C = A – B | % D = C / B | |||
| I: Staff expenditure | 34 084 796 | 31 376 172 | 2 708 624 | 8.6 |
| II: Administrative expenditure | 11 790 977 | 11 057 016 | 733 961 | 6.6 |
| III: Operational expenditure | 5 808 178 | 7 720 921 | - 1 912 743 | - 24.8 |
| TOTAL | 51 683 951 | 50 154 109 | 1 529 842 | 3.1 |
Budget execution of 2023 funds by chapter
| Title and chapter | Budget appropriations | Total Commitments | Total Payments | ||||
|---|---|---|---|---|---|---|---|
Voted A | Assigned B | Total C=A+B | EUR D | % F=D/C | EUR G | % H=G/C | |
| I: Staff expenditure | 34 242 930 | 176 602 | 34 415 532 | 34 084 796 | 99.0 | 33 802 658 | 98.2 |
| 11 Staff in active employment | 32 156 886 | 165 969 | 32 322 855 | 32 148 444 | 99.5 | 32 146 477 | 99.5 |
| 12 Expenditure relating to staff management and recruitment | 600 479 |
| 600 479 | 529 786 | 88.2 | 436 870 | 72.8 |
| 13 Mission expenses, travel and incidental expenses | 98 846 | 2 422 | 101 268 | 86 202 | 85.1 | 85 270 | 84.2 |
| 14 Socio-medical infrastructure | 783 279 | 4 211 | 787 491 | 749 894 | 95.2 | 725 649 | 92.1 |
| 15 Training | 455 940 |
| 455 940 | 426 345 | 93.5 | 273 392 | 60.0 |
| 17 Representation expenses, receptions and events | 147 500 |
| 147 500 | 144 126 | 97.7 | 135 000 | 91.5 |
| II: Administrative expenditure | 12 076 721 | 50 264 | 12 126 985 | 11 790 977 | 97.2 | 10 494 134 | 86.5 |
| 20 Rental of building and associated costs | 4 247 063 |
| 4 247 063 | 4 235 112 | 99.7 | 4 091 645 | 96.3 |
| 21 Information and communication technology | 6 672 846 |
| 6 672 846 | 6 504 839 | 97.5 | 5 663 482 | 84.9 |
| 23 Current administrative expenditure | 709 682 | 42 345 | 752 027 | 624 270 | 83.0 | 351 891 | 46.8 |
| 24 Postage and telecommunications | 48 000 | 7 919 | 55 919 | 42 688 | 76.3 | 42 688 | 76.3 |
| 25 Information and publishing | 399 130 |
| 399 130 | 384 068 | 96.2 | 344 428 | 86.3 |
| III: Operational expenditure | 6 352 351 | 178 175 | 6 530 526 | 5 808 178 | 88.9 | 3 823 466 | 58.5 |
| 31 General operational expenditure | 2 283 962 | 3 407 | 2 287 369 | 1 875 008 | 82.0 | 1 225 380 | 53.6 |
| 32 IT expenses for operational purposes | 4 068 389 | 174 768 | 4 243 157 | 3 933 170 | 92.7 | 2 598 086 | 61.2 |
| Total | 52 672 002 | 401 041 | 53 073 043 | 51 683 951 | 97.4 | 48 120 258 | 90.7 |
Budget outturn
The budget outturn of EUR 1 080 883 was driven primarily by underspend of EUR 1 005 089 on the 2023 budget, with a further EUR 71 989 generated by cancellation of commitments carried over from 2022.
Cancellation of commitment and payment appropriations for the reporting year
The 2023 budget year was characterised initially by constraints on spending as a result of higher-than-expected salary indexation and general inflation. As the year went on, these constraints eased as the number of TA and CA hitting the budget was 5-10 % below target. At the end of the year, a number of planned guideline translations were delayed resulting in further appropriations going unused.
Cancellation of commitment and payment appropriations carried over
One hundred and eight commitments were carried over from 2022. The EBA decommitted 1.1 % of the value of commitments carried over i.e., EUR 71 989 from a total of EUR 6 322 359
Budget outturn for 2021-2023
2021 | 2022 | 2023 | |
|---|---|---|---|
| Reserve from the previous years’ surplus (+) | 339 610 | 467 881 | 605 145 |
| Revenues actually received (+) | 49 681 484 | 50 628 924 | 52 468 356 |
| Payments made (-) | -41 873 122 | - 43 982 571 | - 48 857 367 |
| Carry-over of appropriations (-) | -7 298 331 | - 7 059 468 | - 3 945 729 |
| Cancellation of appropriations carried over (+) | 86 867 | 124 390 | 71 989 |
| Adjustment for carry-over of assigned revenue appropriations from previous year (+) | 63 153 | 166 169 | 737 110 |
| Exchange rate differences (+/-) | -3 200 | - 2 982 | 1 379 |
| Adjustment for negative balance from previous year (-) | - | - | - |
| Total (draft) surplus | 996 461 | 342 343 | 1 080 883 |
Budget transfers
In 2023, the EBA processed 27 budget transfers, of which 6 included transfers between titles. All of the transfers between titles were below the 10% threshold that would have required MB approval.
Budget transfer statistics
| Year | No of transfers | Comments | ||
|---|---|---|---|---|
Within the same title | Between titles | Total | ||
| 2023 | 21 | 6 | 27 | All transfers between titles were below the 10% threshold |
| 2022 | 16 | 7 | 23 | All transfers between titles were below the 10% threshold |
| 2021 | 13 | 14 | 27 | All but two transfers between titles were below 10% threshold |
A summary per budget chapters of the budget amendments and transfers made in 2023 is available in the table below.
Budget amendments and transfers per chapter
| Title and chapter | Voted budget A | Amendments B | Transfers C | Final budget D = A + B + C |
|---|---|---|---|---|
| Title 1 Staff expenditure | 33 515 237 | 23 080 | 704 613 | 34 242 930 |
| 11 Staff in active employment | 29 575 823 | -103 423 | 275 265 | 29 747 665 |
| 11.33 Employer's pension contributions | 2 280 771 | 128 450 | - | 2 409 221 |
| 12 Expenditure relating to staff management and recruitment | 387 948 | -1 009 | 213 540 | 600 479 |
| 13 Mission expenses, travel and incidental expenses | 34 518 | - | 64 328 | 98 846 |
| 14 Socio-medical infrastructure | 819 737 | -938 | -35 520 | 783 279 |
| 15 Training | 406 940 | - | 49 000 | 455 940 |
| 17 Representation expenses, receptions and events | 9 500 | - | 138 000 | 147 500 |
| Title 2 Administrative expenditure | 12 319 866 | -18 318 | -224 827 | 12 076 721 |
| 20 Rental of building and associated costs | 4 148 361 | -14 197 | 112 899 | 4 247 063 |
| 21 Information and communication technology | 7 112 580 | -4 121 | -435 613 | 6 672 846 |
| 23 Current administrative expenditure | 654 295 | - | 55 387 | 709 682 |
| 24 Postage and telecommunications | 48 000 | - | - | 48 000 |
| 25 Information and publishing | 356 630 | - | 42 500 | 399 130 |
| Title 3 Operational expenditure | 6 842 451 | -10 314 | -479 786 | 6 352 351 |
| 31 General operational expenditure | 2 914 712 | -10 314 | -620 436 | 2 283 962 |
| 32 IT expenses for operational purposes | 3 927 739 | - | 140 650 | 4 068 389 |
| Total | 52 677 553 | -5 552 | - | 52 672 002 |
Chairperson and Executive Director expenses
Mission, representation and other expenses in accordance with Articles 11 to 15 of Annex VII to the Staff Regulations amounted to EUR 9 581 for the Chairperson and EUR 6 166 for the Executive Director.
Transaction processing
The tables below show the volume and value of commitments and payments processed in 2023 compared to 2022, irrespective of the source of funding. This includes any commitments (decommitments) and payments related to the budget appropriations carried over from the previous year (C5 and C8).
Commitments (including all fund sources, top-ups and decommitments)
| Commitments | 2023 | 2022 | Movement | % |
|---|---|---|---|---|
| Volume | 841 | 659 | 182 | 28 % |
| EUR | 52 436 316 | 50 223 023 | 2 213 293 | 4 % |
| Average value | 62 350 | 76 211 | -13 861 | -18 % |
Payments (on all fund sources, including carry forward)
| Payment orders | 2023 | 2022 | Movement | % |
|---|---|---|---|---|
| Volume | 1 320 | 1 201 | 119 | 10 % |
| EUR | 54 370 627 | 50 824 175 | 3 456 452 | 7% |
| Average value | 41 190 | 42 318 | -1 128 | -3 % |
The figures above include batch payments (referred to as mass payment load (MPL). The EBA uses MPL for payments to:
- staff: for salaries and allowances, for missions reimbursements, and for contributions including the home office contribution and public transport contribution;
- SNE and trainees: of monthly allowances and travel allowances.
The table below provides more data on these batch payments. They have contributed to a significant workload increase, as the supporting documentation for each of the individual payments contained within an MPL is subject to ex-ante control.
Payments by mass payment load (MPL) excluding staff salaries and SNE/trainee allowances
2023 | 2022 | Movement | % | |
|---|---|---|---|---|
| Number of MPL | 51 | 32 | 19 | 59 % |
| Total number of individual payments | 609 | 315 | 294 | 93 % |
| Total value | 194 443 | 86 167 | 108 276 | 125 % |
Recovery orders
| Recovery orders | 2023 | 2022 | Movement | % |
|---|---|---|---|---|
| Volume | 123 | 108 | 15 | 14 % |
| EUR | 54 754 731 | 53 199 170 | 1 525 705 | 3 % |
| Average value | 445 136 | 492 585 | -47 698 | -10 % |
Supplier invoices – payment timing
The figure below compares payment timing in 2023 with previous years, by block of five days. In 2023, 19 % of payment requests were paid within 10 days and 27% of payment requests paid in the period 10-15 days after reception. These payment times are slower than was seen in 2022, due to two main factors: the EBA was dealing with an overall increase in transaction volumes, while Finance operated for the full year short one and a half FTE.
Payment timing statistics 2021-2023
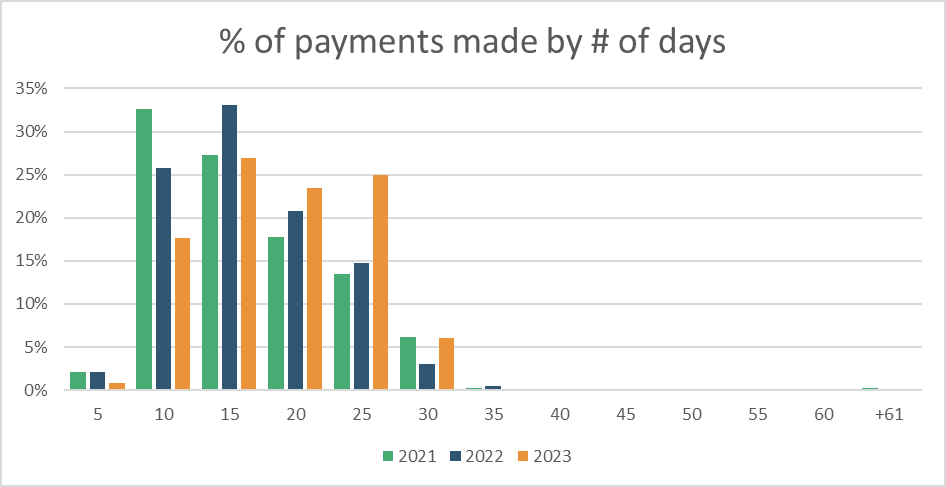
In 2023, the EBA paid only two invoices after the due date. This is an improvement on 2022, particularly given the increase in the number of invoices paid. However, on one of these invoices (from the European Commission) the EBA was required to pay late payment interest of EUR 607. This is the first late payment interest paid by the EBA since 2013.
Invoice processing statistics
2023 | 2022 | 2021 | |
|---|---|---|---|
| Total number of invoices paid | 869 | 802 | 751 |
| Late registration (> 7 days) | 16 | 3 | 9 |
| Invoices paid after the deadline (nr.) | 2 | 5 | 5 |
| Invoices paid after the deadline (%) | 0.0 | 0.6 | 0.7 |
| Average time to pay (days) | 13 | 15 | 15 |
| Number of suspended invoices | 99 | 87 | 79 |
| Average payment suspension (days) | 26 | 42 | 32 |
When the EBA receives an invoice that is incorrect, not in accordance with the underlying contract, or where clarification is required, the EBA has the option of ‘suspending’ it in the accounting system (ABAC). This pauses the payment time clock, so that the suspended invoice does not go past its due date while the issue is being resolved. Finance keeps a measure of this because such invoices drive an increase in workload for staff that have to spend time trying to resolve the issue.
Legality and regularity indicators (linked to paragraph 2.3.3 of the report)
| Indicator | 2023 | 2022 |
|---|---|---|
| Stage 1: Procurement | ||
| Number of planned procedures cancelled | 1 | 1 |
| Number of procedures > EUR 15,000 where only one or no offers were received | 3 | 3 |
| Average number of requests for clarification regarding tender specifications | 8 | 20 |
| Number of ‘valid’ complaints or of litigation cases filed | Zero | Zero |
| Number of companies excluded from participation in public procurement/awarding | Zero | Zero |
| Stage 2: Financial transactions | ||
| Number/amount of liquidated damages due to delays in the implementation of the work | Zero | Zero |
| Number of transactions ‘refused for correction’ (all transactions, not only procurement) - Commitments - Payments - Recovery orders |
115 (14%) |
72 (11%) |
| Step 3: Supervisory measures | ||
| Ex post control: % of transactions controlled by: - volume - value | 2.5 % 2.0 % | 1.2 % 3.0 % |
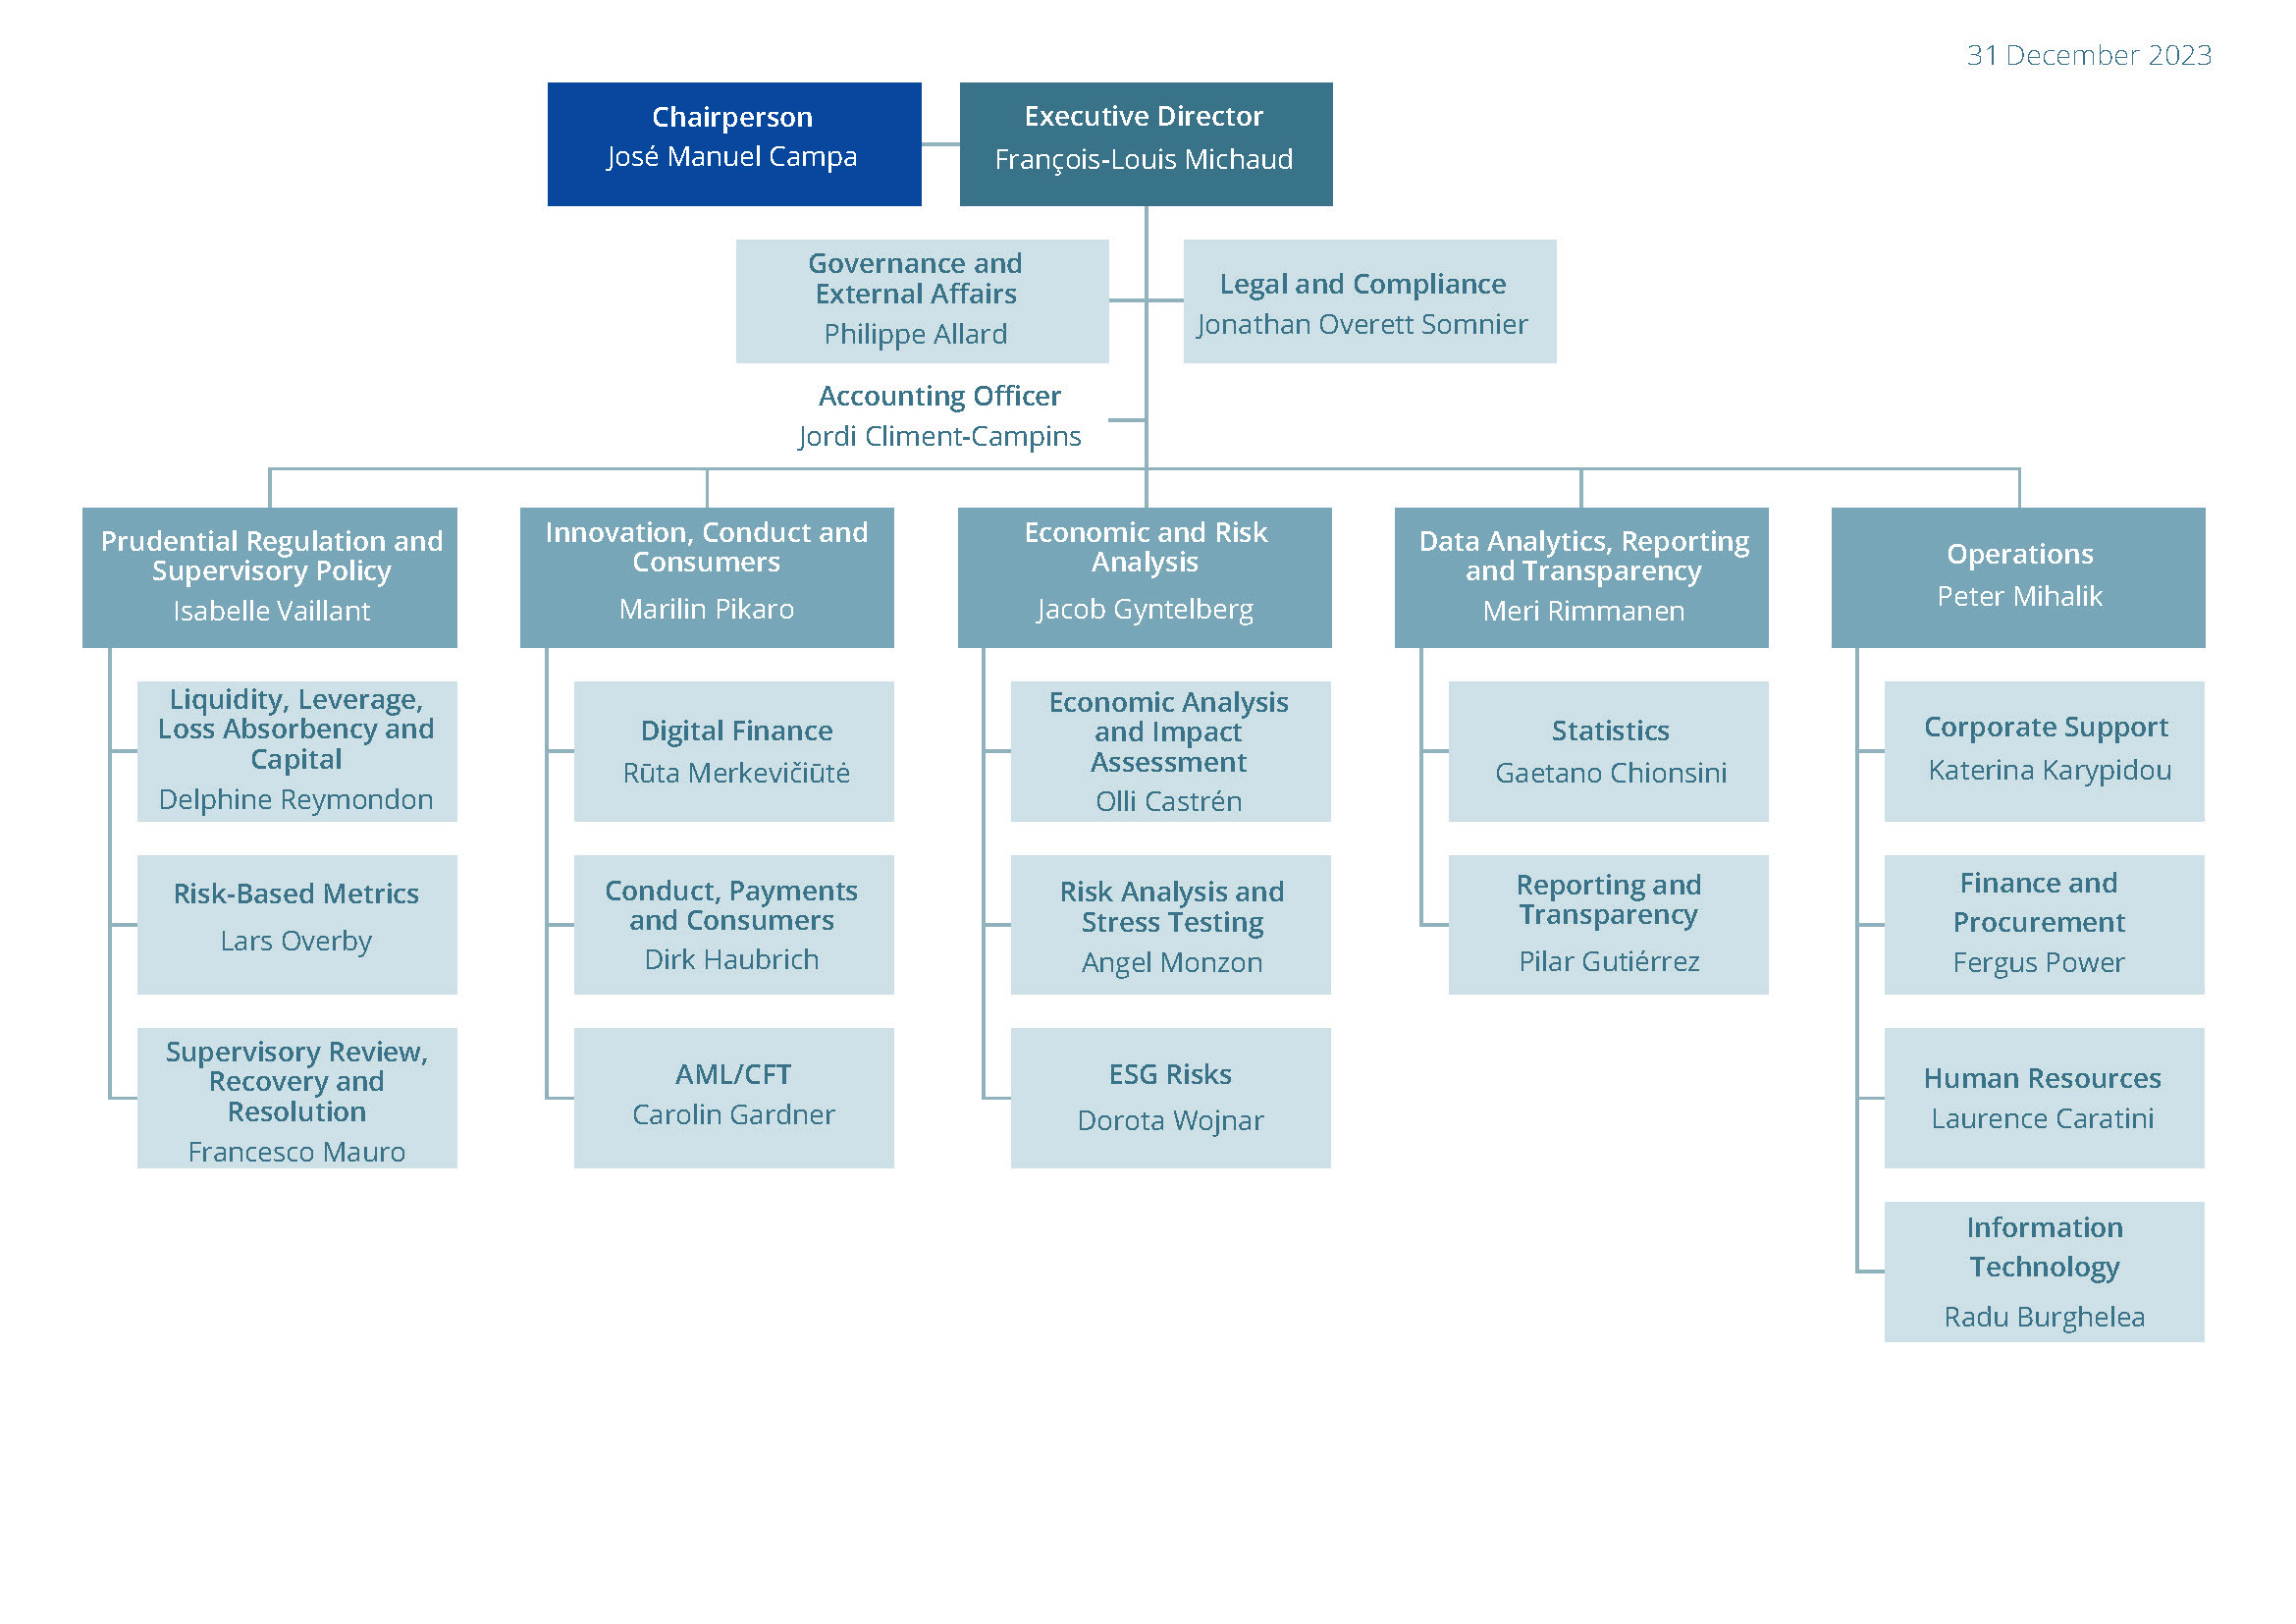
Annex III - Organisation chart (31 December 2023)
Annex IV – Establishment plan and additional information on human resources management
Establishment plan
Function group and grade | 2023 Year N-1 | |||
|---|---|---|---|---|
Authorised budget | Actually filled as of 31.12.2023 | |||
Permanent posts | Temporary posts | Permanent posts | Temporary posts | |
AD 16 |
| 1 |
| 0 |
AD 15 |
| 1 |
| 1 |
AD 14 |
| 5 |
| 3 |
AD 13 |
| 2 |
| 0 |
AD 12 |
| 8 |
| 9 |
AD 11 |
| 12 |
| 6 |
AD 10 |
| 13 |
| 17 |
AD 9 |
| 24 |
| 23 |
AD 8 |
| 27 |
| 26 |
AD 7 |
| 30 |
| 30 |
AD 6 |
| 19* |
| 18 |
AD 5 |
| 30 |
| 17 |
AD TOTAL | - | 172 |
| 150 |
AST 11 |
|
|
|
|
AST 10 |
|
|
|
|
AST 9 |
|
|
|
|
AST 8 |
|
|
|
|
AST 7 |
|
|
|
|
AST 6 |
| 3 |
| 1 |
AST 5 |
| 4 |
| 2 |
AST 4 |
| 2 |
| 2 |
AST 3 |
| 1 |
| 3 |
AST 2 |
| 2 |
| 3 |
AST 1 |
| 0 |
| 0 |
AST TOTAL | - | 12 |
| 11 |
AST/SC*TOTAL | - | - |
| - |
TOTAL | - | 184 |
| 161 |
|
|
|
| |
|
|
|
|
|
*The EBA will take the opportunity to convert one TA/AST into AST/SC when becoming free.
Information on recruitment grade / function group for type of post
| Key functions | Type of contract | Function group, grade of recruitment |
|---|---|---|
| Chair Management Board | TA2(a) | AD 15 |
| Executive Director | TA2(a) | AD14 |
| Director of Department | TA2(f) | AD12 |
| Head of Unit | TA2(f) | AD 9 |
| Head of Sector | n/a | n/a |
| Senior Officer, Senior Specialist, etc. | TA2(f) | AD 8 |
| Officer, Specialist | TA2(f)/CA | AD 6-7 – CA FG IV |
| Junior Officer | TA2(f) | AD 5 |
| Senior Assistant | TA2(f)/CA | AST4- CA FG III |
| Junior Assistant | n/a | |
| Secretary to Chair, ED, Director | CA | FG IV |
| Secretary | CA | FG III |
| Mail Clerk | n/a | |
| Data Protection Officer | TA | AD 6 |
| Accounting Officer | TA | AD 6 |
| Internal Auditor | n/a |
Job screening/benchmarking:
| Job type (sub)category | 2022 | 2023 |
|---|---|---|
| Administrative support and Coordination | 12.3% | 11.6% |
| Administrative support | 9.0% | 8.7% |
| Coordination | 3.3% | 2.9% |
| Operational | 82.5% | 84.6% |
| Top level Operational Coordination | 4.4% | 4.8% |
| Programme Management and Implementation | 32.4% | 34.5% |
| Evaluation& Impact assessment | 12.9% | 12.4% |
| General operational | 32.8% | 33.0% |
| Neutral | 5.2% | 3.8% |
| Finance/Control | 5.2% | 3.8% |
| Linguistics | 0% | 0% |
Implementing rules in compliance with Article 110 of the Staff Regulations
| Working time and hybrid working | Commission Decision C(2022)1788 |
| Engagement of CAs | Model Decision C(2019)3016 |
| Engagement of TAs | Model Decision C(2015)1509 |
| Middle Management | Model Decision C(2018)2542 |
| Type of posts | Model Decision C(2018)8800 |
Schooling
The EBA considers schooling to be an essential part of its staff policy. For this purpose, the ‘European School la Défense’ has been granted accreditation for all levels from ‘Maternelle’ to the European Baccalaureate. A full nursery, primary and secondary education cycle is available for the English section while, besides a full nursery and primary cycle, a secondary cycle is opening gradually for the French section. Hence, the EBA is maintaining exceptionally its education contribution policy for certain staff members under certain conditions (e.g. if the child is in the final two years of the secondary cycle or the child attends a significant part of their school activities (equal to or more than 70%) in a language other than those offered by the European School in Paris.
The EBA continues to work on direct agreements with schools and nurseries in Paris. On the basis of these agreements, the EBA pays tuition fees up to the threshold directly to the nurseries/schools. The amounts exceeding the threshold will be borne by staff members.
School year 2022–2023:
| Nursery: up to 4 years old | 38 |
|---|---|
| Maternelle: more than 4 years old and up to 6 years old | 23 |
| Primary: more than 6 years old and less than 11 years old | 40 |
| Secondary: more than 11 years old and less than 19 years old | 62 |
| Total | 163 |
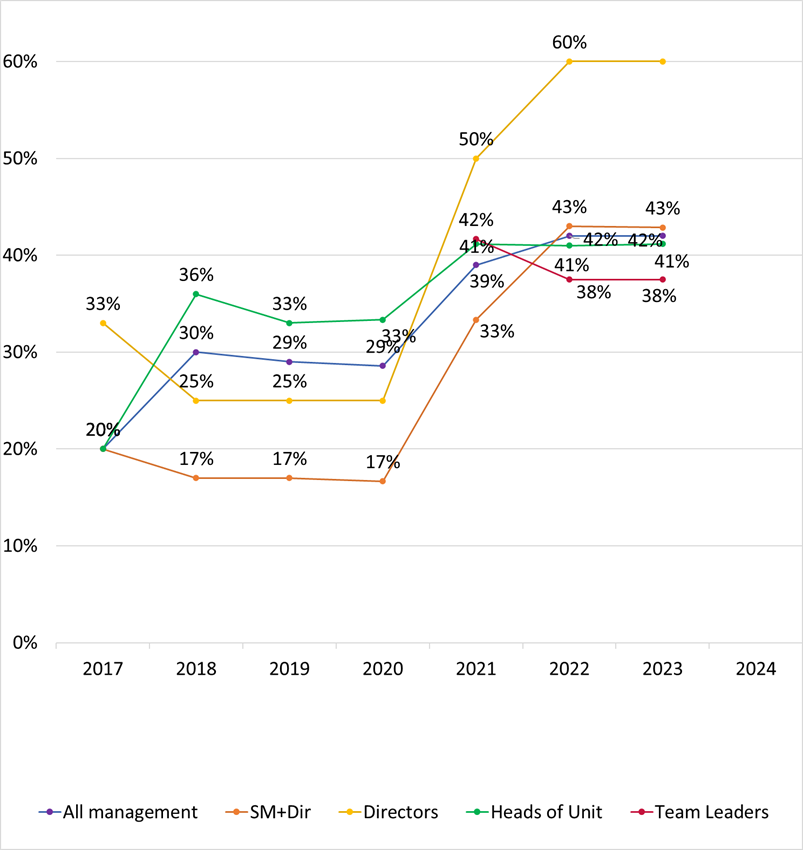
Increase of female leadership over five years for senior management (Chairperson, Executive Director, Directors), middle management (Heads of Unit) and Team Leaders:
Figure 14: Female management and team leaders from 2017 to 31 December 2024
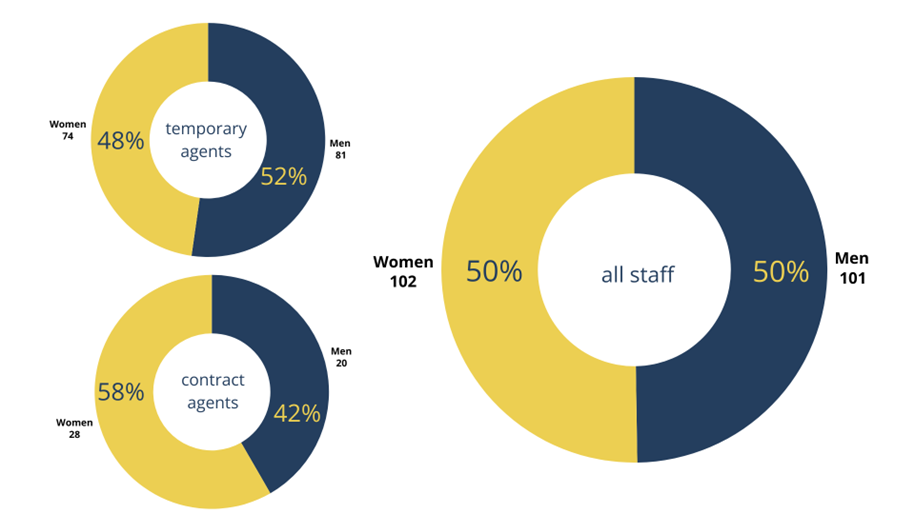
Statutory staff (TAs/CAs): gender balance
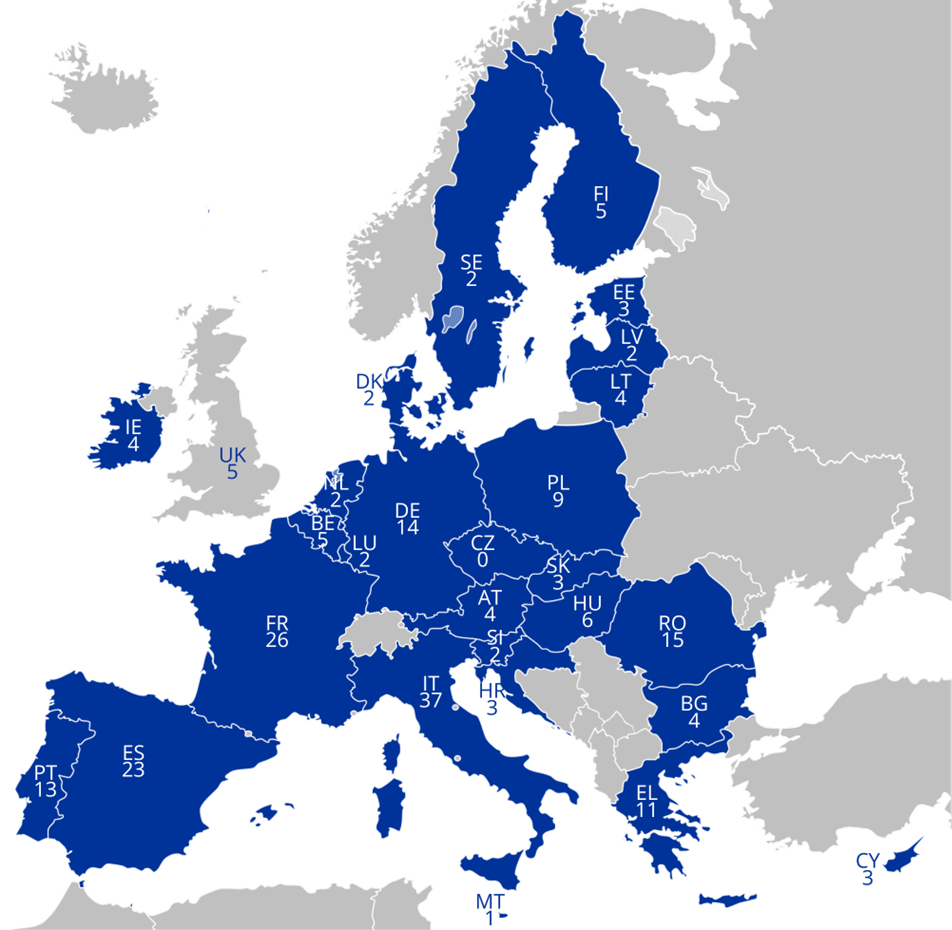
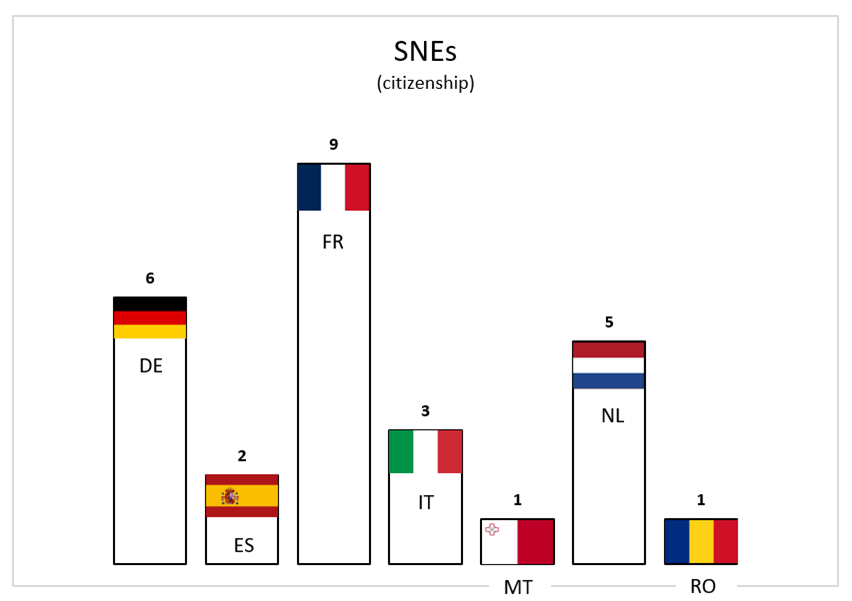
Statutory staff (TAs/CAs) and SNEs: geographical balance
Annex V – Human and financial resources by activity
The table below summarises the resource allocation per activity and details the type of resource: TAs, CAs or SNEs. Management staff and their assistants are distributed over the activities within their respective remits, hence the staffing numbers per activity not being whole numbers. (Minor differences in totals are due to rounding.)
| Activity (preceded by priority they contribute to) | TAs | CAs | SNE | Total | 2023 Cost (EUR) | |
|---|---|---|---|---|---|---|
| Policy and convergence work | 70.1 | 12.1 | 9.1 | 91.4 | 22,732,408 | |
| VP1 | Activity 1 - Capital, loss absorbency, and accounting | 7.5 | 0.2 | - | 7.7 | 2,119,265 |
| VP1 | Activity 2 - Liquidity, leverage, and interest rate risk | 3.5 | 0.1 | - | 3.6 | 948,453 |
| VP1 | Activity 3 - Credit risk (incl. large exposures, loan origination, NPL, securitisation) | 7.9 | 1.8 | 2.0 | 11.8 | 2,613,554 |
| VP1 | Activity 4 - Market, investment firms and services, and operational risk | 7.6 | 0.6 | 1.0 | 9.2 | 2,206,046 |
| VP1 | Activity 5 - Market access, governance, supervisory review and convergence | 9.6 | 0.2 | 1.0 | 10.8 | 2,713,463 |
| VP1 | Activity 6 - Recovery and resolution | 3.8 | 0.1 | - | 3.9 | 1,115,659 |
| HP1 | Activity 7 - ESG in supervision and regulation | 6.4 | 0.7 | 1.0 | 8.1 | 2,009,494 |
| VP4 | Activity 8 - Innovation and FinTech[8] | 10.8 | 3.7 | 1.0 | 15.6 | 3,866,192 |
| VP5 | Activity 9 - Payment services, consumer and depositor protection | 5.7 | 1.3 | 3.0 | 10.1 | 2,228,658 |
| VP5 | Activity 10 - Anti-money laundering and countering the financing of terrorism | 7.4 | 3.4 | - | 10.8 | 2,911,625 |
| Risk assessment and data | 35.6 | 14.7 | 5.1 | 55.4 | 12,802,507 | |
| VP3 | Activity 11 - Reporting and transparency framework | 10.0 | 1.0 | 1.0 | 12.0 | 3,238,718 |
| VP2 | Activity 12 - Risk analysis | 5.0 | 0.2 | - | 5.2 | 1,434,640 |
| VP2 | Activity 13 - Stress testing | 3.9 | 0.2 | 3.0 | 7.1 | 1,522,805 |
| All | Activity 14 - Regulatory impact assessments | 9.5 | 1.7 | 1.0 | 12.2 | 2,995,606 |
| VP3 | Activity 15 - Data infrastructure and services, statistical tools | 7.3 | 11.6 | - | 18.9 | 3,610,738 |
| Governance, Coordination and support | 51.5 | 16.7 | 5.1 | 73.3 | 16,886,146 | |
| ALL | Activity 16 - EBA governance, international affairs, communication | 5.1 | 7.4 | 2.0 | 14.5 | 2,889,813 |
| ALL | Activity 17 - Legal and compliance | 12.8 | 0.4 | 3.0 | 16.3 | 3,194,472 |
| ALL | Activity 18 - Resources (HR and finance) | 13.3 | 3.8 | - | 17.1 | 3,636,255 |
| ALL | Activity 19 - Infrastructures (Information technology and corporate support) | 20.3 | 5.1 | - | 25.4 | 7,165,606 |
| Total | 157.2 | 43.6 | 19.3 | 220.1 | 52,421,061 |
A shared accounting services arrangement with ESMA was introduced in 2021 to exploit synergies resulting from both authorities being now based in Paris. According to this arrangement, updated in 2023, the EBA is providing 50% of the time of its accounting officer to ESMA.
Annex VI – Contribution, grant and service level agreements; Financial Framework Partnership Agreements
In 2022, the EBA signed an SLA with DG REFORM whereby the EBA provides services to the EU Supervisory Digital Finance Academy (https://eusdfa.eui.eu) over a period of four years. Under the terms of this SLA, DG REFORM is funding one TA and one CA for three years, as well as other costs arising from the EBA's support to the EU SDFA.
General information | Financial and HR impact | |||||||||
Date of signature | Total amount | Duration | Counterpart | Short description | 2022 | 2023 | ||||
| Service-level agreements | ||||||||||
| 1. SLA with DG REFORM | 14/09/2022 | € 1 079 515 | 4 years | DG REFORM | Supporting the EU Supervisory Digital Finance Academy (EU-SDFA) | Amount | CA | PA | CA | PA |
44 682 | 44 682 | 214 772 | 214 772 | |||||||
| Number of TAs | - | 0.49 | ||||||||
| Number of CAs | - | 0.34 | ||||||||
| Total service-level agreements | Amount | CA | PA | CA | PA | |||||
44 682 | 44 682 | 214 772 | 214 772 | |||||||
| Number of TAs | - | 0.49 | ||||||||
| Number of CAs | - | 0.34 | ||||||||
| TOTAL | Amount | CA | PA | CA | PA | |||||
44 682 | 44 682 | 214 772 | 214 772 | |||||||
| Number of TAs | - | 0.49 | ||||||||
| Number of CAs | - | 0.34 | ||||||||
Annex VII – Environmental management
In 2023, the EBA maintained its EMAS registration. The 2023 environmental statement (with data from 2021 and 2022) was positively verified and validated by independent external auditors. The EBA environmental policy and annual environmental statement are now published on the EBA’s website: https://www.eba.europa.eu/about-us/sustainable-eba.
The EBA response to the climate and energy crises and its reporting on its climate and energy performance were positively evaluated in the European Court of Auditors’ annual report on EU agencies for the financial year 2022. The ECA checked whether the agencies a) undertook or planned measures to improve their energy efficiency and to reduce their carbon footprint; b) implemented sustainability reporting or issued environmental statements, and c) introduced the EU Eco-Management and Audit Scheme.
Communication and promotion of EMAS
Within the framework of the inter-agency EMAS Twinning Programme, the EBA supported eight European agencies in their process of establishing and implementing EMAS: Cedefop, Cepol, the European Union Agency for Asylum, the European University Institute, Frontex, Fusion for Energy, the Translation Centre and Berec.
The EBA actively promoted EMAS sustainability and environmental management through, among other things, an EMAS social media campaign, an inter-agency spin-off session on communicating EMAS, and Interinstitutional EMAS Days.
The EBA participated in the pan-European EMAS campaign, posting environment and sustainable finance-related content on social media between 30 May and 9 June 2023. Under hashtags #EMAShero and #WeForEMAS, the EBA released tweets, posts and videos on Twitter and LinkedIn.
Colleagues from the Communications and Corporate Support teams presented the EBA's successful EMAS communication strategy and visual identity during a common spin-off session of HCIN and the Greening Network of European Agencies on 29 June 2023.
The EBA, together with ESMA and EIOPA, participated for the first time in the Interinstitutional EMAS Days in November 2023, the annual event of EMAS-registered organisations. The ESA’s experts presented Introduction to sustainable finance: greenwashing, financing the transition to a sustainable economy, and financial education.
The EMAS e-learning programme was developed in-house. Throughout 2023, more than 230 people completed this obligatory EMAS training (TAs, CAs, SNEs, trainees and consultants). They learnt a) what EMAS is, how it works, why it was implemented and how it can be beneficial; b) the place of EMAS in the global and European context (UN SDP, Paris Agreement, European Green Deal, EMAS and ISO); c) how EMAS was implemented at the EBA.
In addition to the dedicated webpage Sustainable EBA | European Banking Authority , the EMAS logo is now also visible on the main EBA website.
Environmental objectives and targets
In 2023, the EBA implemented, among others, the following measures to achieve its environmental objectives and targets, as planned in the Single Programming Document for that year.
| Aspects | 2023 objectives | Main actions implemented by the EBA in 2023 to improve its environmental performance and reduce its carbon footprint |
| Travel | EBA visitors and staff are informed about sustainable ways of travel. Chargers for electric and/or hybrid vehicles are available for staff on the premises.
| In its Environmental Policy, the EBA committed to minimising its impact on greenhouse gas emissions, with a special focus on travel. The EBA maintained its reduced levels of business travel and the number of meetings. The EBA continues to offer public transport contribution to its employees. Moreover, thanks to the EBA’s intervention the building – Tour Europlaza – installed a bike pump station. The installation of chargers for electric and hybrid vehicles by the EBA was postponed, because as from 2025 this will be the obligation of the landlord. In 2023, the EBA continued to raise awareness about sustainable ways of travel. In particular, the EBA updated its mission and meetings organisation to include sustainable considerations throughout the workflow. Firstly, the handbook for visitorsnow contains a section on sustainability at the EBA where guests are shown ways in which they could contribute to a greener EBA. Secondly, all registered meeting participants and the EBA’s staff on business travel are now invited to consider sustainable means of travel when making their transport and accommodation plans. Thirdly, relevant information is shared on the intranet and during induction training for newcomers. Fourthly, the EBA also actively promoted sustainable meetings and missions externally. We exchanged best practices with, among others, the Reflection group on greening and missions of the European Commission. |
| Waste |
Circular economy policy is adopted to reduce waste generation. | In its Environmental Policy, the EBA committed, among other things, to improving its waste production, segregation and recycling as expected by the EBA’s staff. To contribute to this objective, in 2023 the EBA adopted a circular economy policy, in which it commits to: a) minimising purchases of physical items so as to limit our material impact, b) buying to keep, c) maximising the life cycle of products, d) minimising the generation of waste, e) disposing of items in an environmentally friendly manner and f) introducing and promoting environmental best practices. The EBA has initiated the first exercise in decommissioning its IT equipment in a sustainable manner (donation, disposal). |
| Energy |
Energy consumption in the building is reduced by 5% (baseline 2022). | In its Environmental Policy, the EBA committed, among other things, to building a strong relationship with its landlord to improve energy consumption performance. In June 2023, the EBA signed a new contract for the provision of 100% of electricity from renewable energy sources (RES), confirmed by certificates of origin. The EBA continued to adopt energy-saving measures, already implemented in 2022, such as adjusting heating schedules and temperatures, decreasing light intensity, switching off hot water boilers and shutting down AV back-end infrastructure overnight. On top of these things, the EBA commissioned a technical report on energy efficiency. In 2023, the EBA managed to achieve its energy reduction targets. It also committed to further reductions in subsequent years as well. |
| IT | The migration to efficient public cloud data centres is finalised. | In 2023, the EBA successfully transitioned its IT landscape, including the data centres, from a traditional set-up to a future-proof cloud infrastructure. This strategic move has yielded substantial environmental benefits. By adopting a pay-as-you-consume model, we have achieved greater workload flexibility and improved server utilisation rates. As a result, we have significantly reduced unnecessary energy consumption and our carbon emissions footprint. Additionally, we have optimised our applications and services by leveraging cloud-native capabilities, thereby further minimising their environmental impact. Based on performance benchmarks, we anticipate a substantial reduction in carbon emissions due to our cloud migration. To track our progress, we regularly monitor our carbon footprint through the dashboard. |
| Procurement | Contract managers are trained on green public criteria. | All contract managers attended at least one training session on green public procurement and green procurement criteria in the last two years (2022-2023). In total, four sessions were organised (two per year), each one of them attended by the majority of the EBA contract managers. The training sessions included but were not limited to quiz questions and case studies on green requirements and criteria, as well as ways to verify that contractors comply with their environmental contractual obligations. |
| Core business | At least 80% of the EBA’s ESG-related mandates, including contributions to the Commission’s renewed Sustainable Finance Strategy, are delivered on time. | 86% of the EBA’s ESG-related mandates were delivered on time. See Annex I for further details.
|
Annex VIII – Annual Accounts

[1]https://www.eba.europa.eu/sites/default/files/2024-02/b0c38062-0055-4631-b99e-b728f19e3868/Report%20on%202023%20stocktaking%20of%20BigTech%20direct%20financial%20services%20provision.pdf
[2]https://www.eiopa.europa.eu/publications/joint-esas-report-innovation-facilitators-innovation-hubs-and-regulatory-sandboxes_en
[3] https://www.eba.europa.eu/publications-and-media/press-releases/eba-publishes-fourth-opinion-money-laundering-and-terrorist
[4]https://www.eba.europa.eu/publications-and-media/press-releases/supervisors-banks-are-making-progress-fight-against-financial
[5]https://www.eba.europa.eu/sites/default/files/document_library/Publications/Reports/2023/1056453/Report%20on%20ML%20TF%20risks%20associated%20with%20payment%20institutions.pdf
[6]https://www.eba.europa.eu/sites/default/files/document_library/Publications/Reports/2023/1061535/Report%20on%20the%20functioning%20of%20AMLCFT%20colleges%20in%202022.pdf
[7] Moderate risk: possible comment by auditors but unlikely to lead to an observation; insignificant risk: very low risk associated but requires follow-up; process improvement: no issue found but improvement opportunity identified.
[8]Includes MiCA and DORA preparations (mostly through internal resource redeployments as no specific resources were available in 2023), as well as Supervisory Digital Finance Academy