
This Risk Assessment Report (RAR) was prepared by the Economic and Risk Analysis Department[1]. The report has benefited from input and comments from other departments across the European Banking Authority (the EBA), as well as from members of the EBA’s Supervision, Risks and Innovation Standing Committee (SUPRISC) and the EBA’s Board of Supervisors (BoS). Many thanks also to the editors of this version of the RAR. If you would like to provide comments on this report, please write to rast@eba.europa.eu.
Executive summary
EU/EEA banks remain resilient, despite an increasingly challenging macroeconomic environment. European economic activity has continued to show some resilience, although growth remains weak and the outlook is clouded by heightened geopolitical tensions. The wars in the Middle East and Ukraine, trade uncertainty and fiscal pressures continue to weigh on the outlook, with further materialisation of geopolitical risks posing downside risks. Disruptions could transmit to banks through higher energy prices, persistent inflation, tighter financing conditions and weaker borrower repayment capacity.
Profitability remains robust, although performance differs considerably across countries and banks. Net interest income (NII) continues to be the main revenue driver, supported by lending volumes and developments in margins. Rising deposit costs, operating expenses and potential credit losses could weigh on earnings going forward, while the benefits of higher interest rates depend on banks’ repricing structures and borrowers’ resilience.
Capital positions remain strong, but growing risk-weighted assets are putting pressure on the headroom above requirements. Expanding credit exposures and increases in operational risk requirements raised risk-weighted assets (RWA). Sustained profitability supports banks’ capacity to absorb these pressures, while distributions and growth strategies need to remain consistent with resilience under adverse conditions.
Bank asset growth has gained momentum, increasingly supported by corporate lending and to a lesser extent by loans to households. Lending and securities holdings have expanded considerably, yet growth remains uneven across countries and sectors. Financing linked to digitalisation, energy infrastructure and strategic investment supports lending activity, underscoring the need to monitor sectoral concentrations and emerging vulnerabilities.
Rising sovereign exposures potentially strengthen contagious links between banks and public finances. Sovereign bonds held at fair value account for less than half of EU/EEA banks’ sovereign exposures. Higher sovereign yields can generate valuation losses on securities held at fair value, while increasing unrealised losses on portfolios measured at amortised cost. Repricing can also affect collateral values and banks’ funding conditions, while higher yields may weaken borrowers’ debt-servicing capacity, where they translate into higher interest payments for variable-rate loans.
Growth in exposures to non-bank financial institutions (NBFIs) has been considerably stronger than for traditional lending portfolios. Growing exposures to NBFIs and non-EEA counterparties increase banks’ sensitivity to external shocks. Expanding financial interlinkages create channels through which leverage, liquidity mismatches and valuation adjustments outside the banking sector could affect EU/EEA banks. Concentrations in major international markets also expose banks to geopolitical developments, as well as to abrupt market corrections and changes in financing conditions beyond the EU/EEA.
Stable aggregate asset quality indicators might conceal certain pockets of vulnerability. Although non-performing loan (NPL) ratios remain low, elevated Stage 2 shares in some portfolios point to vulnerabilities. In particular, small and medium enterprises (SMEs) and commercial real estate (CRE) lending remain sensitive to rising financing costs and possibly negative economic conditions. NPL formation has increased in certain sectors and countries, warranting closer supervisory scrutiny of emerging credit risk vulnerabilities.
Funding conditions have remained overall favourable, but market access becomes fragile under stress. Banks continue to benefit from diversified funding sources with deposits being the main funding pillar. Higher sovereign yields and wider risk premia raise debt issuance costs or temporarily disrupt primary markets. Greater competition for deposits could add to funding cost pressures, particularly for institutions with concentrated funding structures or substantial refinancing needs.
Strong liquidity buffers support resilience, but their composition and availability remain important. Increasing sovereign securities holdings within liquid asset portfolios heighten sensitivity to market valuations. Aggregate liquidity ratios can also conceal vulnerabilities across currencies and institutions, making foreign-currency liquidity, depositor concentration and the capacity to mobilise collateral important areas of scrutiny.
Cyber threats, fraud and information and communication technology (ICT) disruptions remain key sources of operational risk for banks. Fraud risk continued to rise, driven by digitalisation and technology. The most important risk channels include compromised or stolen customer credentials / social engineering, payment fraud, and online and cyber-fraudulent activities. Regarding major ICT incidents, most reported major incidents were due to system failures and external events as the root causes. Increasingly sophisticated attacks, including artificial intelligence (AI)-enabled fraud, can compromise customer data, disrupt payments and banking services and generate financial losses and reputational damage. Reliance on common third-party providers, particularly for cloud infrastructure and critical ICT services, creates concentration risks. These dependencies can also complicate incident response and delay the restoration of critical services.
AI offers significant opportunities for banks while amplifying existing vulnerabilities and introducing new risks. A large majority of banks that are covered by the EBA’s Risk Assessment Questionnaire (RAQ) expect reductions in operational expenditures (OPEX), mainly based on the assumption that AI usage will increase employees’ productivity. The survey also reveals that the majority of banks have access to frontier AI models. However, there are indications that smaller banks may lag behind in taking advantage of this technology, appearing less optimistic about the benefits of AI. AI adoption can also create challenges relating to data quality, model complexity and reliance, governance and third-party dependencies, while also increasing the sophistication and scale of cyberattacks and fraud. RAQ results also show that banks already use AI models for the detection and/or remediation of software flaws, system weaknesses and similar. The substantial investment needs of the AI ecosystem warrant monitoring of related exposures and valuation risks, including from the ICT sector more broadly.
Advances in quantum computing could create new risks for banks. These relate to cryptography and data security, as development of sufficiently powerful quantum computers could compromise widely used public-key cryptographic schemes. At the same time, opportunities may also emerge including improvements in areas such as portfolio optimisation, risk modelling or fraud detection.
Environmental, social and governance (ESG) risks remain relevant to banks’ resilience while ESG-related litigation adds a further channel for potential financial and reputational losses. Climate- and nature-related disputes are growing across sectors and jurisdictions, making environment-related litigation an increasingly relevant vulnerability for banks due to potential legal, reputational, strategic, credit and market risk implications.
1. Macroeconomic environment and market sentiment
Despite the demonstrated economic resilience, geopolitical tensions remain a key source of uncertainty for the economic outlook
Geopolitical fault lines have deepened across an increasingly fragmented world. Russia’s war against Ukraine and the widening conflicts in the Middle East have intensified uncertainty and disrupted global energy prices affecting economic prospects. The war in Ukraine reshaped the European gas supplies and pushed up energy costs, while instability in the Middle East and the closure of the Strait of Hormuz have added a substantial premium to oil and gas prices through concerns over production, trade routes and shipping disruptions (Figure 1). Against this challenging backdrop, the European economy has so far remained relatively resilient. However, its outlook remains uncertain, not least due to its external dependency on energy price developments. A further escalation of geopolitical conflicts could adversely affect the macroeconomic outlook through price pressures on energy and other commodities. At the same time, the risk of higher tariffs has not abated and renewed trade tensions could disrupt supply chains, increase input costs and weigh on global trade, investment and economic growth. These could lead to tighter financing conditions, disrupted trade flows and weaker domestic and external demand.

Source: Refinitiv
Economic activity has charted a more resilient course than was expected before geopolitical conflicts and trade disputes erupted. The European Central Bank (ECB), the Organisation for Economic Co-operation and Development (OECD) and the International Monetary Fund (IMF) have revised their projections of real GDP growth slightly upward and are currently projecting 0.9% to 1% growth, respectively, for 2026 in the euro area (EA). Alongside rising government spending on defence and infrastructure, investments in AI and a resilient services sector have contributed to stabilising economic activity. The labour market is also projected to remain resilient, with stable unemployment rates in the EA. On the other hand, headline inflation rose to 3.2%, remaining above the ECB’s inflation target, primarily reflecting higher energy prices (Figure 2). ECB projections reflect the persisting inflationary pressure, as inflation is expected to stand at 3.0% in 2026, only reducing to 2.5% in 2027 and 2.1% in 2028[2]. However, given the critical role of energy prices in economic development, a more prolonged period of elevated energy prices could weaken the economic outlook and exacerbate inflationary pressures.

Source: Eurostat

Source: Refinitiv
Renewed inflationary pressures have shifted expectations towards a tighter monetary policy stance, driving money market rates higher. Following two increases in the ECB’s key interest rates in summer, market participants expect further monetary tightening in the EA. In other EU/EEA Member States, the situation was similar. For instance, central banks in Sweden, Norway and the Czech Republic have increased their monetary policy rates in recent months. For the banking sector, this environment could entail both benefits and risks. European banks could benefit as higher interest rates could provide renewed support to profitability by widening net interest margins, not least depending on the steepness of the yield curve, and particularly where asset yields reprice faster than deposit and wholesale funding costs. Higher interest rates could also pose downside risks to asset quality. Highly leveraged borrowers remain vulnerable, as elevated debt-servicing costs may weaken repayment capacity and increase the likelihood of default (see Chapter on Asset quality trends).
Divergent developments in European real estate markets amid improving housing affordability
Following the increase in interest rates in 2022, housing affordability improved as disposable incomes continued to grow while residential property prices stabilised (Figure 3). Since mid-2024, however, house prices have resumed their upward trend, albeit with considerable cross-country variation. While house prices in the European Union increased year-on-year by 4.7% in Q2 2026 on average, prices rose by more than 15% in Bulgaria and Portugal. The upward trend for house prices is supported by recovering mortgage demand, lower financing costs, continued income growth and stable employment conditions. At the same time, persistent housing supply shortages, reflecting limited construction activity and higher construction costs, continued to exert upward pressure on prices.
CRE markets continued to exhibit pronounced heterogeneity. While aggregate CRE prices in the EA stabilised during 2025, developments across segments remained fragmented. Strong demand for prime offices and constrained supply of high-quality buildings supported valuations in countries such as the Netherlands and Greece. By contrast, Germany continued to face downward valuation pressures also in the first half of 2026 amid increasing vacancy rates and persistent structural changes in office occupancy patterns (Figure 3).
Looking forward, while real estate markets appear to be gradually stabilising on aggregate, risks remain skewed to the downside. In residential real estate markets, strong price growth could contribute to affordability pressures and increasing leverage of households. In CRE markets, the combination of elevated financing costs, refinancing pressures and structural shifts – such as through telework or in retail/logistics due to a continued change in shopping behaviour, data centre demand, or changes in tourist preferences – in demand might continue to challenge valuations and market liquidity. A deterioration in macroeconomic conditions or a persistence of higher interest rates could amplify these vulnerabilities.

Source: ECB

Source: BIS and OeNB
Elevated valuations and funding needs of AI firms may pose broader market risks
European equity markets have benefited from improving growth prospects and comparatively attractive valuations, while US market performance has remained heavily driven by technology firms. Against this backdrop, equity markets rapidly recovered their losses following the outbreak of the Iran war, yet heightened and broader geopolitical uncertainty and changing interest rate expectations remain among the key drivers of the increased volatility in equity markets. At the same time, after outperforming broader equity markets in the first quarters of the year, European banking stocks have recently undergone a price correction, underscoring investors’ concerns about the sustainability of the sector’s earnings and the overall macroeconomic landscape (Figure 4).
Nonetheless, this overall solid performance should not obscure the downside risks facing equity markets, particularly the potential for a sharp correction in elevated AI-related valuations and the resulting spillovers to broader market sentiment, including debt markets. Market participants and analysts have increasingly highlighted risks related to elevated valuations and the concentration of returns in a small number of technology companies. Given the uncertainty surrounding future returns on AI-related investments, any downward revision of earnings expectations could lead to abrupt asset repricing and increased market volatility. This can materially affect banks through higher market risk and a deterioration in credit quality as well as their funding and liquidity. At the same time, the accelerated pace of new AI model development introduces significant operational risk and IT security challenges for financial institutions (see separate Box 1 on AI).

Source: S&P Capital IQ

Source: S&P Capital IQ
A series of geopolitical and economic crises has significantly limited fiscal flexibility
Beyond stretched market valuations and renewed inflationary pressures, rising sovereign debt and mounting fiscal vulnerabilities are emerging as an increasingly prominent source of risk. Rising inflation expectations and (geo)political developments are not the only drivers for the rise in sovereign yields. Concerns about sovereign debt sustainability – in the US, Europe and other regions – also affect them[3]. At the same time, substantial AI funding needs affect debt markets through greater competition for investor capital. In addition, rising yields in Japanese yen (JPY) have made carry trades using JPY funding less attractive. Developments in September and October this year, when rising sovereign yields spilled over into broader financial markets affecting also banks and other financial institutions, showed how quickly these risks can materialise. In recent years, global economies have faced heightened volatility and uncertainty driven by a multitude of events. The COVID-19 pandemic in combination with the Russian war in Ukraine weighed significantly on economic activity and increased the need for government spending. Subsequently, the increase in interest rates since 2022, together with rising demand for defence and security capabilities, has contributed further to a rise in government spending in the EU/EEA (Figure 5). Combined with other sovereign expenditures (e.g. social security contributions) and demographic challenges, the scope for future fiscal interventions is becoming increasingly limited.
Higher public debt levels and sovereign bond yields may increase risks through the sovereign-bank nexus. European banks hold significant volumes of government debt, making them vulnerable to declines in sovereign bond prices as yields rise. Concerns about fiscal sustainability could weaken banks’ balance sheets through valuation losses on sovereign bond holdings and may negatively affect capital positions as well as their funding costs. Constrained government fiscal capacity to support borrowers during stress periods may amplify credit risk within the banking system. This feedback loop could amplify market volatility, tighten financial conditions, and pose risks to financial stability across Europe.

Source: Refinitiv

Source: Eurostat
 Box 1: Artificial intelligence related risks and opportunitiesArtificial intelligence (AI) affects banks through several channels, i.e. they are facing AI-related challenges in different areas. This includes the adoption of AI in their day-to-day business activities and operations, which not least may improve efficiency. AI-related challenges also affect banks’ ICT risks, in particular cyber-risks. Banks may also be affected directly through financing of AI-related investments and indirectly through their exposure to firms and markets influenced by the AI investment race associated with the rapid growth of the sector. Impact on banks’ business and operationsRAQ results show that EU/EEA banks appear broadly optimistic about the possible impact from AI on their business in general. A large majority of banks expects an overall positive impact while no bank assumes an overall negative effect. However, the RAQ results also indicate that large and medium-sized banks are more optimistic, whereas smaller banks are more cautious regarding the overall AI impact. Smaller banks outside the RAQ sample might be even more cautious or pessimistic than those covered by the RAQ. Anecdotal evidence for instance suggests that bigger banks have so far made more progress in respect of AI usage than their smaller peers. Besides general positive expectations from AI usage, RAQ results also show that nearly three quarters of the banks already have access to frontier AI models. Looking at cost impacts of AI adoption, nearly two thirds of banks covered by the RAQ expect reductions in OPEX and around one third expect the impact to be neutral on a net basis, while only one bank expects a negative impact. These estimations are mainly driven by the expectations that AI usage will increase employees’ productivity, according to the RAQ results (Figure 6). EU/EEA banks’ expectations of AI-driven efficiency are broadly optimistic, and recent reports from some banks already suggests that they indeed manage to generate cost savings. This for instance includes areas like programming or handling of legacy systems, but also loan origination processes or similar. However, it remains to be seen whether these benefits will materialise as expected. This optimism may be challenged, for example, considering news in recent months which showed that companies faced a sudden unexpected rise in AI usage costs. Besides OPEX reduction, EU/EEA banks expect further positive impact from AI usage in the areas of customer onboarding/servicing, such as anti-money laundering checks, sanctions compliance, credit assessment, etc., as well as improved fraud detection and prevention. These potential benefits are welcome but warrant caution. AI models may perform well in most cases, yet can also produce inaccurate or unreliable outputs, with adverse consequences for banks when they are used in critical processes or decisions. In addition, potentially delegating tasks to AI agents – which can be done in different degrees – increases risks of loss of human control, opaque decision making and increased speed of shock propagation. Furthermore, a key vulnerability associated with use of third-party AI models centres on governance, in particular, an inability to understand and validate underlying models and model inputs. This also poses a significant challenge to address. AI can also increase automation bias. An example would be that certain employees rely on and trust AI more than human expertise for certain tasks. It can also increase the dependency on certain AI providers in terms of concentration risk, with many of them being headquartered in the US. These are the risks that banks need to identify and effectively manage amid growing AI usage, especially where this occurs in highly regulated areas and in relation to critical functions. Finally, AI could also indirectly increase banks’ funding costs, as increased client usage of AI tools to compare returns may lead to shifting funds into higher yielding deposits or investments. This could intensify competition for deposits and, as such, exert pressure on banks to raise their deposit rates while increasing the uncertainty around liquidity risk management. 
Source: EBA Risk Assessment Questionnaire, autumn 2026 Impact through rising cyber and ICT risksAI may significantly augment cyber risks, not least amid early evidence that AI is increasingly used by cyber threat actors[4]. One of the key concerns is that attackers use AI to identify and explore flaws and weaknesses in software. Banks may mitigate these risks through common countermeasures as well as by proactively using AI models to detect and to address such weaknesses in their software themselves. RAQ results show that nearly two thirds of the banks already use AI models for the detection and/or remediation of software flaws, system weaknesses and similar. However, another key concern is that EU banks may not be able to access frontier AI models for those purposes, considering that a majority of developers of such models are headquartered outside the EU. Banks seem to be aware of those risks. Nearly all banks agree that recent developments in the cyber threat landscape (including AI-related developments) led their institution to modify their approach to cybersecurity (ca. 30% said significantly, nearly 70% said to some extent). The areas that most widely faced modifications seem to confirm greater usage of AI-based solutions by the banks themselves. These solutions include vulnerability management (e.g. faster vulnerability identification) and monitoring capabilities (e.g. AI-assisted detection of software flaws) (Figure 7)[5]. Another key concern is dependency on non-EU/EEA jurisdictions in respect of AI models. RAQ results confirm the elevated dependency on US providers and indicate that banks seem to be making efforts to source from European suppliers[6]. Around 80% of the banks source AI models that they use from the US, and around half of that number source AI models from European suppliers. Chinese and other models are only marginally used according to these results (Figure 8). Going forward, it is important that banks effectively identify and manage such dependencies across the AI supply chain – from suppliers and geographies – during the full lifecycle of third-party risk management, and that they also adequately use AI models in their cyber and ICT risk management[7]. Impact from the AI – and ICT sector’s more broadly – funding needsAnother channel of AI-related risk is related to the substantial financing required for AI infrastructure including hardware, in particular data centres of large US technology companies, often referred to as hyperscalers. Corporate bonds have so far been the primary source of external financing, also often cited as an additional cause for the rise in bond yields in autumn 2026 (see respective coverage in Chapter on Macroeconomic environment and market sentiment above). Financing arrangements in which private credit funds are involved also play an important role[8]. So far, EU/EEA banks had on average limited involvement in this financing. As of Q2 2026 EBA supervisory reporting data indicates only limited, but significantly growing direct exposures to the ICT sector more broadly[9]. Furthermore, RAQ results show that the ICT sector is one of the sectors for which a relatively large share of banks expects growing loan demand (see the analysis in Chapter on NACE code specific exposures as well as expected loan for selected sectors). Yet the increasing trend of ICT sector exposures is not only related to the heightened financing needs of AI. It is presumably also driven by the financing needs of other ICT subsectors. At the same time, financing investments in the EU/EEA’s ICT sector is important for strengthening Europe’s technological capacity and supporting the competitiveness of its economy[10]. However, it should in any case be ensured that banks apply proper risk management and pricing of these exposures. The rapid development of AI has also raised concerns about the software sector more broadly, as AI could disrupt established business models and weaken the prospects of some firms. This development seems to be slightly reflected in recent asset quality developments of EU/EEA banks’ ICT sector exposures, which showed a deterioration last year, but again improved in recent quarters. The NPL ratio reached 2.9% as of Q2 2026, which is better than the 3.3% for the non-financial corporates (NFC) segment overall. It also compares with an NPL ratio of ICT sector exposures of 3.2% as of YE 2025, and a near-bottom of 2.1% as of YE 2024 (YE 2020: 2.8%). The recent decline in the NPL ratio should be interpreted with caution as it may reflect improving asset quality, but growth in the loan portfolio may also affect the ratio. The performance of exposures to the ICT-related sector therefore warrants continued monitoring, particularly given the uncertainty about the effects of AI on established business models. EU/EEA banks’ direct exposures to the sector appear on average relatively limited which may contain the immediate credit impact of a deterioration in asset quality on the EU/EEA banking sector, although indirect effects through financial markets and other borrowers could be broader. Such indirect effects could feed through defaults of bonds on financial markets, which could then result in elevated financial market volatility and possible rising yields and/or times of closed primary markets. It could also affect EU/EEA banks indirectly through their interlinkages with private credit funds, if these funds have AI-related exposures (on interlinkages between EU/EEA banks and private credit entities, see the last RAR edition). These potential indirect interlinkages with the AI sector require monitoring by banks. |
2. Asset side
2.1 Assets: volume and composition
Banks of the EU/EEA continued to expand their balance sheets at elevated pace in the first half of 2026. Total assets reached around EUR 30.9 tn in June 2026, approximately 6.5% higher than a year earlier, with loans and advances increasing by around 7.2% and debt securities by 13%. Cash balances, by contrast, declined by around 9%, continuing the gradual normalisation from the cash buffers accumulated in previous years (see also Chapter on liquidity). The changes in year-on-year growth rates were driven mainly by developments in the first half of 2026. Although lending and securities holdings grew more rapidly over the past year, the asset mix of EU/EEA banks changed only modestly, with debt securities continuing to gain ground, reaching 15.6% of total assets (14.7% a year earlier), second to loans and advances (63.1%) (Figure 9).
Investment-related sectors increasingly drive corporate credit growth
Corporate lending was an important driver of overall credit growth over the past year. Loans to NFCs rose by around 6.4% YoY to EUR 6.84 tn in June 2026, compared with a growth of around 5.3% in household lending. Loans to customers (NFCs and households) grew at broadly similar rates within and outside the EEA albeit with some variations across counterparties and segments. Within the corporate book, lending to large corporates increased by about 7.3%, compared with around 5.0% for SMEs[11].
The acceleration in corporate lending is notable, given that it took place during a period marked by heightened uncertainty due to the ongoing conflict in the Middle East, renewed energy-price pressures and an unstable geopolitical landscape. Part of the increase in nominal loan stocks may also mechanically reflect higher inflation, but the breadth of the expansion suggests that the recovery is not merely a price effect. Europe’s investment in energy, transport and digital infrastructure, alongside plans to expand defence capacity, is creating financing needs for companies and their supply chains. Banks are therefore called upon to support corporates for equipment, facilities and working capital, although the impact on banks’ lending varies across countries.
Lending to NFCs in the information and communication sector increased by around 24% YoY to EUR 272 bn in June 2026. The particularly strong expansion of information and communication exposures is consistent with sizeable financing needs associated with digitalisation and the build-out of AI-related infrastructure. Investment needs related to computing capacity, connectivity and broader technological upgrading may therefore continue to support credit demand, while the expansion across utilities, transport and manufacturing suggests that the investment cycle is broadening beyond technology-related activities. Despite this rapid increase, the sector still accounted for only around 4% of corporate lending and about 1.9% of total client lending. Lending to electricity and gas utilities rose by around 15% to EUR 427 bn, transport and storage by around 14% to EUR 393 bn, and professional, scientific and technical activities by around 9% to EUR 377 bn. Manufacturing remained a much larger part of the NFC portfolio, at around EUR 1.0 tn, or close to 15% of the NFC portfolio, but grew more moderately, by around 4%.
The expansion of lending across these sectors supports investment but also increases banks’ exposures to a more uncertain operating environment. Renewed energy price shocks, trade disruptions and weaker demand could affect manufacturing and transport borrowers, while large energy and digital projects may be vulnerable to cost overruns or returns materialising later than expected. On the other hand, lending to construction companies declined across all jurisdictions, with French and Austrian banks accounting for the largest reductions and Spanish banks also contributing to the overall contraction. This broad-based decline may reflect the lagged effects of earlier monetary tightening on property demand and construction investment, alongside elevated construction costs and uncertainty weighing on the viability of new projects. These factors can delay investment decisions and reduce financing needs, while concerns about borrowers’ repayment capacity may also constrain banks’ willingness to lend. The decline could therefore reflect a combination of subdued credit demand and tighter lending standards, consistent with the tightening reported for the construction sector in the ECB’s bank lending survey (BLS) (Figure 11)[12].

Household lending grows steadily, with marked differences across countries
Household lending also demonstrated strong growth, although slightly lower than the corporate lending growth. Between June 2025 and June 2026, household loans increased by around 5.3% across the EU/EEA. Mortgage lending, which accounts for the largest share of household loans, continued to grow (+5.4%), while consumer credit expanded at a faster pace but from a smaller base (+6.9%). The acceleration in household lending warrants close monitoring, as risks associated with new lending may become visible only with a lag. Higher energy costs, inflation or weaker employment could strain borrowers’ repayment capacity, particularly among highly indebted households and those facing loan repricing. Rapid growth also calls for continued scrutiny of lending standards and borrower indebtedness, especially in consumer credit, where loans are generally unsecured, and in housing markets where prices have risen strongly.
In both corporate and household lending, developments remained uneven across countries, reflecting differences in housing markets, household income growth, industrial sectoral differences and borrowing costs. Lithuania, Bulgaria and Hungary recorded strong increases in lending to both NFCs and households, while developments remained more subdued in Germany and Italy. Growth patterns also differed within countries. NFC lending outpaced household lending in Greece, Spain and France, whereas household lending expanded faster in Norway and Austria. These differences suggest that the aggregate increase in lending masks distinct credit conditions and risk profiles in domestic markets as well as in the other key markets in which respective banks have major business.
Growth in exposures towards NBFIs warrants closer scrutiny
Growth in banks’ exposures to financial counterparties has been considerably stronger than in traditional lending portfolios. Loans to other financial corporations (OFC, in the following also referred to as NBFIs) increased by around 18.5% YoY to EUR 1.74 tn in June 2026, while exposures to credit institutions rose by around 11%. The pace of growth underscores the increasing relevance of banks’ interconnections with non-bank financial institutions, including through lending to private credit funds and other forms of financing to NBFIs. Although exposures to NBFIs remain smaller than traditional household and NFC lending portfolios (and exposures to private credit funds remain limited[13]), their expansion warrants close monitoring as they can amplify the transmission of stress from the NBFI sector to the banking sector. Their rapid growth could increase banks’ vulnerability to stress in the sector through credit exposures, liquidity commitments and indirect counterparty links. NBFI-related stress could also reach banks directly through drawings of credit lines or financial guarantees that banks have provided, as well as margin calls. A more indirect impact could come through forced asset sales that NBFIs might face, which then erode asset values. Shared borrowers and limited transparency over some non-bank exposures may make these channels difficult to identify before risks materialise.
US exposures lead a broader expansion beyond the EEA
EU/EEA banks’ exposures to counterparties outside the EEA reached EUR 5.8 tn in June 2026, up by 13% year-on-year and equivalent to 19% of total assets. Across the non-EEA portfolio, the increase was driven mainly by higher holdings of sovereign bonds (close to EUR 110 bn) and growth in lending to NBFIs (increase of EUR 200 bn) and large corporates (close to EUR 160 bn). The US remained by far the largest individual market, with exposures rising from around EUR 1.42 tn to EUR 1.66 tn. Loans to US NBFIs increased by more than EUR 100 bn to EUR 540 bn, while lending to large US corporates rose by around EUR 55 bn to EUR 450 bn. Exposures to the UK increased from approximately EUR 0.98 tn to EUR 1.05 tn. Developments across smaller individually reported markets were mixed, including a decline in exposures to Japan.
The risk implications of such international expansion depend on the type of counterparty as well as its location. Exposures to advanced economies reflect EU/EEA banks’ extensive cross-border business but can still be affected by changes in economic conditions, market prices and counterparty creditworthiness. The rise in US NBFIs lending merits particular attention, as collateral values, leverage and funding pressures may change quickly during periods of market stress. Larger sovereign bond holdings also increase sensitivity to changes in yields and sovereign risk premia. Geopolitical and geoeconomic shocks can reach banks beyond their direct exposures to the countries most affected. Trade restrictions, supply-chain disruption and changes in energy prices may weaken borrowers abroad and EU-based firms with significant external customers or suppliers. Overall, the rise in non-EEA exposures increases the importance of monitoring geographic and counterparty concentrations alongside indirect economic links. An adverse external shock could affect loan performance, counterparty exposures and securities values at the same time, with the impact differing across banks according to their business models and geographic footprints.
Rising sovereign exposures increase sensitivity to fiscal and market risks
Fiscal expansion and higher public investment may provide further support to corporate credit demand, particularly through infrastructure, defence, energy and digital investment. At the same time, however, higher government financing needs have increased the relevance of sovereign exposures on banks’ balance sheets. EU/EEA banks’ sovereign exposures have increased markedly since mid-2024, reaching around EUR 4.5 tn in June 2026, with an annual growth rate of more than 10% over the last two years. Banks are also entering the yield rise in autumn this year holding bonds with a longer duration than before. Banks in Spain (+EUR 70 bn) and Germany (+EUR 64 bn) accounted for a significant part of the increase. Relative to banks’ capital, sovereign exposures increased from around 206% of Common Equity Tier 1 (CET1) in June 2024 to 244% in June 2026. 43% of EU/EEA banks’ sovereign exposures are to their domestic sovereign. While still significant, this share has gradually declined over recent years.
The increase in sovereign holdings strengthens the link between banks’ balance sheets and developments in government bond markets. The accounting treatment of these exposures and the chosen risk management approach also matter for the transmission of market movements, as changes in sovereign yields and spreads directly affect holdings measured at fair value. Close to 40% of EU/EEA banks’ sovereign exposures are measured at fair value (fair value through other comprehensive income (FVOCI) 19% and fair value through profit or loss (FVTPL 18%)), leaving close to EUR 1.6 tn directly exposed to valuation losses due to rising yields, with potential effects on profitability or capital depending on the accounting classification. Higher or more volatile sovereign yields could therefore imply valuation effects and, more broadly, increase banks’ funding costs and sensitivity to fiscal developments (Figure 12).
The higher yields can reach banks through several channels. They include, first, capital losses arising from the FVOCI and FVTPL (including trading) portfolios. Second, as yields rise, the market value of government bonds held as high-quality liquid assets (HQLA) falls, and the liquidity buffers counted in the liquidity coverage ratio (LCR) decline. Haircuts on repo collateral and central bank collateral may also widen. Third, bank bond spreads tend to follow their home sovereign’s spread, therefore banks may, for example, face higher costs for market-based funding, which partly offsets the gain to their NII from higher rates. These risks are particularly relevant in an environment in which several governments face rising sovereign debt, with interest payments for these adding an additional burden going forward. A simplified analysis of a 100 bps increase in yields on sovereign exposures at FVTPL and FVOCI shows that the resulting losses would amount to less than 2% of T1 capital for more than half of the banks, and less than 4% for approximately three quarters of the banks[14].
Forward-looking indicators point to continued but increasingly differentiated credit growth
Forward-looking indicators continue to support the outlook for credit growth, although expectations are increasingly differentiated across sectors. According to RAQ results, expectations of increasing corporate loan demand remain robust for the security and defence industry, with 73% of banks anticipating increasing demand, followed by energy and utilities at 65% and technology and telecommunications at 53%, all reported higher compared to last year’s survey. By contrast, expectations have weakened in more traditional sectors, with the share of banks anticipating stronger demand in manufacturing declining from 26% to 21% and in retail and wholesale trade from 19% to 15%. This suggests that the corporate lending outlook remains supportive but increasingly concentrated in sectors benefiting from strategic and investment-related expenditure (Figure 13).
Household credit demand remains supportive, although the outlook for mortgages has moderated. Around 49% of banks expect mortgage demand to increase over the next 12 months, down from 55% in March 2026 and 62% in September 2025. Consumer credit shows the opposite, albeit more moderate, development, with the share of banks expecting stronger demand rising to 39% from 36% in both previous survey rounds. The latest responses therefore point to continued expansion in household lending, but with some rebalancing between mortgages and consumer credit and a less pronounced contribution from mortgage demand than in previous rounds. RAQ results also point to differences in expected loan demand across countries and regions in several lending segments. These differences are most pronounced for consumer credit. In particular, a large share of banks in Eastern EU Member States expect consumer credit demand to increase, followed by banks in Southern Member States, while expectations for consumer credit demand are more subdued in Western and Nordic Member States[15].
The factors supporting household loan demand nevertheless remain mixed. RAQ responses indicate that real-estate dynamics and consumer confidence are among the more supportive factors, while the impact of interest rates is more balanced, with banks reporting both positive and negative effects. Inflation pressures are more frequently assessed as either a headwind or as having no material impact, whereas fiscal incentives, tightening credit standards and ESG-linked borrowing are predominantly considered to have a limited effect on household loan demand. The outlook for household lending therefore remains dependent primarily on housing-market conditions, household confidence and financing costs rather than on broader policy-related drivers (Figure 14).
Banks’ portfolio plans nevertheless remain expansionary across both corporate and household lending segments. In the latest RAQ, 84% of respondents plan to increase their residential mortgage portfolios over the next 12 months, the highest share among the main lending categories, while 72% intend to expand SME lending, 65% large corporate lending and 64% consumer credit. The comparatively strong appetite for mortgage lending points to continued support for household credit growth, despite some moderation in demand expectations. Appetite for CRE lending expansion remains more moderate at 42% but has increased substantially from 20% in September 2024. More broadly, the historical comparison shows that banks’ willingness to expand lending portfolios remains well above the levels observed two years ago in several segments, particularly mortgages and CRE, while planned growth in SME and large corporate portfolios has remained broadly stable. The results therefore suggest that banks’ balance-sheet plans remain supportive of further credit expansion even where expectations for underlying loan demand have become more mixed (Figure 15).
2.2 Asset quality
Headline asset quality remains resilient, but deterioration is emerging beneath the surface
Headline asset-quality metrics remained broadly resilient in the first half of 2026, although the underlying flow dynamics became less benign. EU/EEA banks reported around EUR 388 bn of NPLs in June 2026, around 4% more than a year earlier. However, total lending expanded at a similar pace, leaving the aggregate NPL ratio broadly unchanged at around 1.83%, compared with around 1.84% in June 2025. The divergence between rising NPL volumes and an almost unchanged ratio therefore partly reflects denominator growth (Figure 16).
Deterioration remains concentrated across countries and portfolios
The broadly stable aggregate NPL ratio at EU/EEA level masks the increasingly heterogeneous developments across countries. NPL volumes increased notably in several banking systems, including France, where they rose by around 9.6% YoY to EUR 136 bn, and Germany, where they increased by around 7.6% to EUR 50 bn. Similar increases were observed in Belgium and Austria. By contrast, NPL volumes continued to decline in a number of jurisdictions, including Italy (-11.2%), Portugal (-19.7%) and Finland (-9.3%). The developments suggest that the recent deterioration remains concentrated rather on some countries than broad-based (Figure 17).
Consumer credit and selected corporate sectors show more visible pressure
Segment-level indicators suggest that asset quality pressures remain selective. The consumer-credit NPL ratio rose to 5.5% in June 2026, from 5.4% at end-2025, while its Stage 2 share increased to around 12% (11.5% in June 2025). By contrast, NPL ratios for mortgages (1.2%), CRE (4.1%) and SMEs (4.4%) remained broadly stable or improved modestly, although Stage 2 shares were still comparatively high for CRE (16.1%) and SMEs (14.2%). The clearest sign of emerging pressure is thus in consumer credit, where higher energy costs and inflation may reduce the repayment capacity of financially stretched households. For SMEs, weaker demand, trade disruption and higher input or financing costs could weigh on cash flows; CRE borrowers may face similar refinancing pressures alongside risks to property values. The elevated Stage 2 shares in these portfolios warrant monitoring, even though their NPL ratios do not yet point to a broad deterioration (Figure 18 and Figure 19).
Manufacturing deserves particular attention
A sectoral view points to further pockets of weaknesses within the NFC loan book. Manufacturing NPL volumes increased by around 12% YoY, while total lending to the sector grew by only around 4%. As a result, the manufacturing NPL ratio increased to around 4.1% in June 2026, from 3.8% a year earlier. The deterioration appears to be also geographically concentrated, with German banks accounting for an important part of the weakening in manufacturing asset quality. This is consistent with broader evidence of increased vulnerabilities in German manufacturing, particularly in automotive and energy-intensive activities. Credit quality also weakened in some fast-growing service sectors, including information and communication, although starting NPL ratios remain lower (Figure 20).
Stable ratios conceal less favourable NPL flows
Static NPL ratios provide only a partial picture and do not necessarily show the gradual build-up of underlying credit vulnerabilities. During the first half of 2026, NPL inflows increased to around EUR 119 bn, roughly 8% above the corresponding period of 2025, while NPL outflows declined to around EUR 103 bn, from approximately EUR 114 bn. This resulted in a net increase in NPLs, reversing the net reductions recorded during both halves of 2025. The deterioration was visible in both corporate and household portfolios. NFCs recorded net NPL inflows of around EUR 11 bn, while households contributed more than EUR 5 bn. Consumer credit accounted for a significant share of the latter (Figure 21).
Stage migrations point to more adverse credit dynamics
Stage migration dynamics reveal a similarly less benign picture. Compared with June 2025, transfers from Stage 2 to Stage 3 increased by around 12%, while direct migrations from Stage 1 to Stage 3 rose by around 17%. At the same time, cures from Stage 2 back to Stage 1 declined by around 7%, while migrations from Stage 3 back to Stage 2 fell by around 18%. The YoY perspective also points to a reversal from 2025, when migrations into Stage 3 had declined and Stage 3-to-Stage 2 transfers had increased. By contrast, Stage 1-to-Stage 2 flows increased only marginally in 2026, suggesting that the deterioration is currently more visible in transitions into default and weaker cure dynamics than in a broad-based migration of performing exposures into Stage 2. Although these flows remain small relative to the overall loan book and have not yet translated into a material increase in aggregate NPL ratios, their recent direction warrants continued monitoring (Figure 22).
Banks remain confident in their asset quality assessments
Despite the increasingly adverse signals emerging from recent NPL flows and stage migrations, banks’ asset quality expectations remain broadly positive. The latest RAQ results continue to point to broadly stable asset-quality expectations across the main lending portfolios, while the comparison with previous survey rounds shows that expectations of improvement have generally remained moderate and heterogeneous across segments. Residential mortgages have tended to attract comparatively more positive expectations in some recent rounds, whereas improvement expectations for CRE, SMEs and several corporate portfolios remain more contained. Overall, the survey evidence does not suggest a broad-based strengthening in asset quality, but rather a broadly stable outlook with differences across individual portfolios (Figure 23).
3. Liabilities: funding and liquidity
3.1 Funding conditions and emerging pressures
Deposits remained central for EU/EEA banks’ liability structure
EU/EEA banks’ liabilities increased by around 6.6% year-on-year to EUR 29 tn in Q2 2026, which comes in parallel with the rise in total assets (see Chapter on asset growth). The liability structure remained broadly stable relative to a year earlier. Customer deposits from households accounted for the largest share of total liabilities, at around 30%, confirming the important role they play in EU/EEA banks’ funding mix. They are followed by debt securities at 20% and deposits from non-financial corporates at 16%, which are likewise important components of EU/EEA banks’ funding. Whereas deposits from households showed a growth rate of around 5% YoY, debt securities rose by 4.7%. Within debt securities issued, secured bonds, which are mainly covered bonds, showed a subdued rise in volumes (volume growth of 3.4%, to a share in debt securities issued of 31.4%), reflecting the YtD dynamics in primary markets. Other customer deposits (i.e. beyond households or NFCs), which include deposits from NBFIs, rose the most, potentially indicating a rising interlinkage between banks and NBFIs on the liability side. Overall, these other deposits, such as those from NBFIs, represent a smaller share of funding of ca. 13%. However, they could serve as a channel for the transmission of NBFI-related stress to banks, namely through abrupt withdrawals of funding by NBFIs.
Cross-country differences in liability structures remained similar to the past. In most EU/EEA countries, customer deposits from households accounted for the largest share of liabilities, whereas banks in the Nordic countries (Denmark, Finland, Iceland, Norway and Sweden) relied comparatively more on market-based funding. In countries such as Germany, Luxembourg, France and Ireland, the liability structure was more balanced across funding sources, which in some cases includes a higher share of deposits from credit institutions. The latter similarly applies to Bulgaria and Czechia, for instance. Increased reliance on deposits from credit institutions can in cases of market stress pose certain risks for banks, as they tend to be withdrawn by counterparties or become quickly more expensive, for instance[16] (Figure 24).
Senior preferred instruments remained the largest source in primary market-based funding activity in 2026
Senior preferred instruments have again remained the largest part of banks’ primary market-based funding activity, with issuance volumes reaching nearly EUR 190 bn. The continued strength of senior preferred issuance underscores its importance as a key funding instrument for banks, supported by broad investor demand and regulatory eligibility for total minimum requirement for own funds and eligible liabilities (MREL). It also shows a shift from some years ago, when covered bonds were the focus of banks’ primary market activity. Drivers for such shifts can be numerous, including a change in relative pricing. The increasing share of senior preferred bonds also confirms what banks had planned, as for instance reflected in previous RAQ results (as also seen in Figure 27). Issuance volumes of preferred senior debt were nearly 20% above last year’s volume and increased even more compared to 2024. Covered bonds ranked as the second-largest issuance segment, with volumes reaching more than EUR 170 bn. The third most important market-based funding instruments are non-preferred senior (NPS) bonds / bonds issued by holding companies (HoldCo), reaching a slightly higher volume than last year. These overall volume trends show that banks have so far been well placed to issue debt and that there has been investor interest.
Issuance volumes were higher this year even though markets slowed down notably in September/October following the developments on sovereign debt markets (see in Chapter on asset growth the analysis of sovereign exposures and potential impact on banks’ funding costs). Senior and subordinated debt was more/longer affected than covered bonds, suggesting that the latter are an instrument increasingly used in crisis times[17]. Nevertheless, anecdotal evidence suggests that banks have already reached their planned funding goals for the year and started prefunding for next year. This also shows that funding markets had been in an overall good state and that banks can manage periods of subdued activity. Finally, looking at subordinated debt issuance activity YtD, T2 issuance volumes declined further in 2026 compared with the levels observed over the previous two years, while Additional Tier 1 (AT1) issuance activity remained broadly unchanged YoY (Figure 25). Looking at the share of green bonds in EU/EEA banks’ issuances, it increased for senior unsecured debt in 2026 YtD and was only slightly below last year’s level for covered bonds, presumably reflecting a growing role of sustainable funding instruments in banks’ funding mix.
Following a tightening over the year, funding spreads widened amid development in debt markets
EUR asset swap (ASW) spreads widened temporarily in March and April 2026 amid heightened macroeconomic uncertainty, partly reflecting the outbreak of the US/Israel/Iran war. They rose again in September/October amid tensions in sovereign debt markets but remained well below stress levels seen when COVID-19 broke out in 2020 or when the full-scale Russian invasion of Ukraine began in 2022. Respective data also shows the tightening of spread differentials between senior preferred and covered bonds, which might help explain the previous noted rising importance of senior preferred bonds relative to covered bonds in EU/EEA banks’ market-based funding mix (Figure 26)[18].
Source: IHS Markit[19]
Going forward, banks’ funding preferences point to a possibly greater role of market-based instruments
RAQ results show that deposits are expected to remain a key focus of banks’ funding mix over the next 12 months, although the emphasis on both retail and wholesale deposits is expected to decline somewhat compared with the previous RAQ iteration, to 54% and 32%, respectively (Figure 27). At the same time, RAQ results point to a stronger focus on market-based funding. Preferred senior unsecured (49%) and NPS/HoldCo bonds (48%) are to be used more over the next 12 months than in the previous RAQ iteration, while secured funding, in particular covered bonds (49%), is also expected to remain among the most relevant funding instruments. Overall, this suggests that, while deposits are expected to remain central to banks’ funding mix, banks are preparing to make greater use of market-based instruments in the coming year.
In the analysis of the focus instruments for future funding, the planned rise in NPS/HoldCo debt is probably the most notable. The share of responses for this debt class has now increased to a level broadly in line with both preferred senior unsecured debt and covered bonds. The rise is presumably driven by a number of factors, including balance sheet growth, which increases the need for subordinated MREL debt, and also maturing instruments in this segment. This is also consistent with RAQ results, which show that banks’ funding strategies are mostly driven by business growth, as well as regulatory and refinancing needs. The growing relevance of market-based funding instruments is seemingly linked to funding needs arising from MREL/total loss-absorbing capacity (TLAC) requirements, cited by 59% of banks, and the need to refinance maturing liabilities, identified by 53% of banks. The continued prominence of deposits is consistent with banks’ focus on supporting loan growth, which 61% of banks identified as a key driver of their funding strategies (Figure 28).
Banks expect funding spreads to remain stable over the next 12 months
Banks generally expect funding spreads to remain stable across all major funding instruments over the next 12 months. Around half of banks expect spreads to remain unchanged, while between 13% and 32% anticipate some widening depending on the instrument. Expectations of higher spreads are most pronounced for AT1s and T2s. Covered bonds are viewed as the most stable funding source, with 61% of banks expecting spreads to remain broadly unchanged (Figure 29). Following the sovereign bond-driven market volatility this autumn, covered bonds could continue gaining relevance. Expectations differ somewhat across bank size categories. Large banks appear more concerned about rising funding costs. Around 45% of large banks expect subordinated debt spreads to increase and 42% expect higher spreads for senior non-preferred / HoldCo instruments. The corresponding shares among small banks are around 20%, while medium-sized banks are generally the least likely to anticipate spread increases. However, one key explanation for this may be that small and medium-sized banks also indicate more frequently that certain market-based funding instruments are not relevant to their funding activities.
Asset encumbrance increased further in the first half of 2026
The asset encumbrance ratio (i.e. the ratio of encumbered assets and collateral received to total assets and collateral received that can be encumbered) increased to 25.8% in Q2 2026, 110 bps above the level recorded in Q2 2025, pointing to a further increase in asset encumbrance during the first half of 2026. The volume of encumbered assets (i.e. the numerator of the ratio) expanded by 12.8% over the period, outpacing the growth in the denominator (i.e. total assets and collateral received) and contributing to the higher encumbrance ratio. The data shows that repo financing remains a key driver for asset encumbrance (37.9% of total encumbered assets), followed by covered bonds (20%). Together, these two funding channels represented the majority of encumbered assets, highlighting their continued importance in banks’ secured funding structures.
The yearly increase in asset encumbrance observed was largely driven by repo transactions which increased by 115 bps. The increase in encumbrance was observed across a broad range of institutions with the largest year-on-year increases recorded in France, Norway and Hungary, where encumbrance ratios rose by around 200 bps or more. The progress in these countries reflects the greater use of collateralised funding and collateral posting activities, while the overall composition of encumbered assets changed little over the period. At the same time, only nine countries recorded a decline in the asset encumbrance ratio, with Cyprus posting the largest reduction (-4.6 p.p.). Another development was the decline in non-encumbered assets in relative terms, which are central bank eligible (decline of the share to total assets from 16.7% to 15.8% in Q2 2026 on a yearly basis). While this movement remains limited, it is not a positive development, especially in periods of elevated market stress, when access to central bank funding – and availability of eligible collateral – can become particularly important. A bank-by-bank analysis indicates that a limited number of banks hold a small stock of unencumbered assets that are central bank eligible.
3.2 Liquidity
EU/EEA banks maintained their robust liquidity positions as of June 2026. Liquidity buffers increased by 2% on a yearly basis from June 2025, while net outflows increased by 4% over the same period. As a result, the weighted average LCR declined to 158.5% in June 2026, from 161.5% in June 2025. On average, the LCR of EU/EEA banks remains well above both the minimum requirement and the pre-pandemic levels (148.7% as of March 2020). No bank reported an LCR close to 100%.
Continued change in liquidity buffer towards sovereign bonds
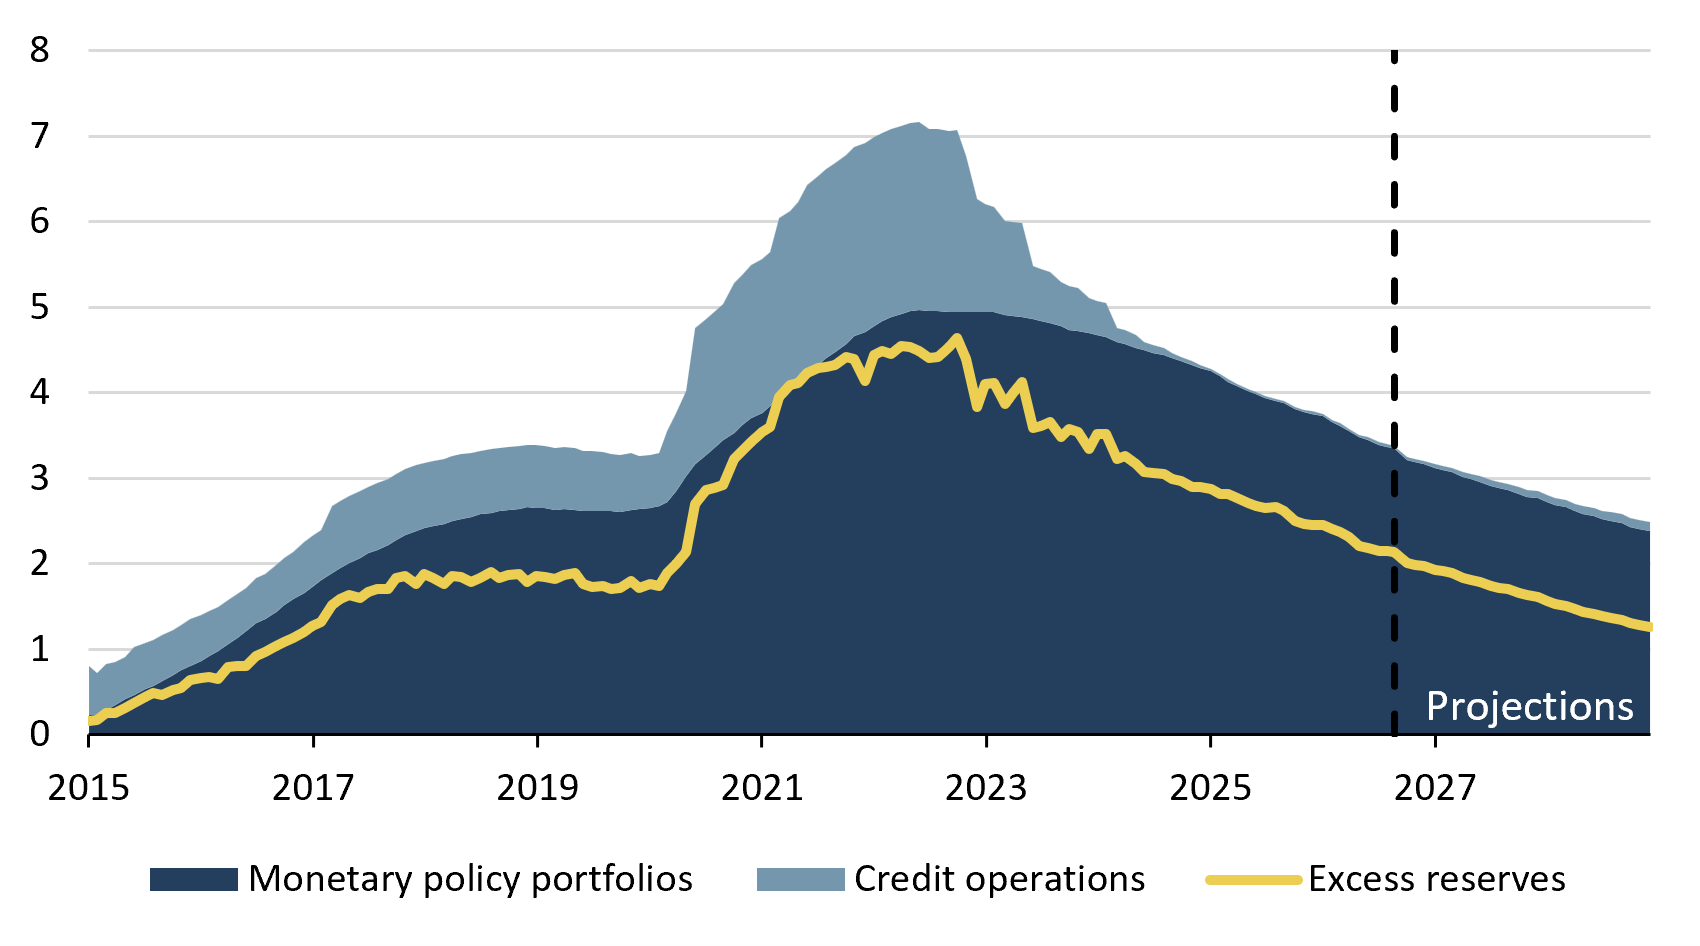
The change in the composition of the banks’ liquidity buffers continued. The reduction in excess central bank reserves amid the normalisation of the central bank balance sheet positions has meant that banks now have to meet their liquidity needs through a broader mix of liquid assets and market-based funding. Throughout the past year, EU/EEA banks continued to replace central bank assets and central bank reserves with sovereign debt, covered bonds, Level 2 assets and cash. The share of Level 1 sovereign assets in HQLA more than doubled between June 2022 and June 2026, rising from 22% to 47%. In the year to June 2026, Level 1 sovereign assets increased by +18%, followed by Level 1 covered bonds (+17%), Level 2 assets (+5%), while Level 1 cash remained broadly stable. By contrast, Level 1 central bank reserves declined by 21% and Level 1 central bank assets by 10%. These developments further changed the composition of liquidity buffers. Level 1 central bank reserves together accounted for 35% of HQLA in June 2026, down from 40% in December 2025 and 44% in June 2025 (Figure 31). Over the same twelve-month period, the shares of Level 1 sovereigns and Level 1 covered bonds increased from 39% to 47% and from 7% to 8% respectively. Level 2 assets continued to account for around 5% of all HQLA.
The growing weight of sovereign assets amplifies liquidity buffers’ sensitivity to changes in yields and sovereign risk premia, especially during periods of market stress (see, for example, in the Chapter on macroeconomic and market developments, including sovereign yield widening). Adverse market movements could reduce the market value of these holdings, and consequently the liquidity buffer available to support the LCR. This underscores the importance of managing the interest rate risk and of the risks arising from changes in credit and liquidity spreads, as well as of maintaining sufficient diversification across sovereign issuers to limit concentration risk and the potential amplification of the sovereign-banking nexus (Figure 30). Looking forward, the structural shift from central bank reserves to sovereign bonds will presumably continue, driven by ongoing central bank balance sheet reduction. As monetary authorities drain excess liquidity, EU/EEA banks must increasingly substitute their shrinking central bank cash with government securities to meet regulatory requirements. This transition reduces immediate intraday liquidity and exposes banks to higher duration and market risks, requiring more active management, for instance, through private repo markets or in times of stress through central bank emergency windows to monetise assets.
Figure 30a: Euro area aggregate development of excess reserves over time (in EUR bn) [20]
Source: ECB and EBA calculations
As regards the LCR outflows, these increased by nearly 8% following a broad-based increase in almost all outflow categories. The main drivers were outflows from collateral swaps, followed by secured lending and committed facilities. Looking further ahead, a further growth of stablecoins or central bank digital currencies (CBDCs) might have an impact on banks’ liquidity[21]. These developments might affect banks in different ways. For example, customers may withdraw deposits and hold them as stablecoins or CBDCs, while stablecoin issuers may place part of their liquidity with banks[22]. It remains to be seen whether these developments will result only in limited changes in banks’ liquidity positions or if they will have a more material adverse impact.
Weighted average LCR for USD remained above 100%
The weighted average LCR in USD continued its declining trend, reaching a low level of 103%, down from 118% a year earlier, pointing to a narrowing liquidity cushion. As of June 2026, the LCR in USD stood below 100% for nearly half of the EU/EEA banks that report it[23]. This may have implications for banks, with some of them being more exposed to the risk of a sudden rise in dollar outflows or a disruption in short-term USD funding markets. The weighted average LCR in GBP was reported lower at 129%, down from 140%, and lower than the overall LCR for the banks reporting LCR in GBP, which warrants monitoring. The LCR value in EUR, which is reported by banks domiciled in non-euro area EU/EEA countries, provides a more reassuring comparison. As of June 2026, it was reported at 159%, up from 155% a year earlier and in line with the overall LCRs for these banks (Figure 32).
NSFR confirms that the overall liquidity position of EU/EEA banks remains comfortable
EU/EEA banks’ net stable funding ratio (NSFR) saw a small decline in 2026, as the increase observed in liquid assets and loans surpassed the increase of deposits and capital instruments. As of June 2026, the NSFR stood at 125.7%, down from 127.2% as of June 2025, indicating a satisfactory level for all EU/EEA countries. All Member States in the sample recorded NSFR levels exceeding 100% as of June 2026, ranging from 115.3% (France) to 241.7% (Lithuania). The weighted average NSFR in USD increased to 95.4% in June 2026, up from 92.8% a year earlier. However, the number of banks with NSFR in USD below 100% increased, and as of June 2026 represents 42% of the total sample (23 out of 55 banks) (Figure 32).
Retail deposits constitute nearly half of banks’ total available stable funding, confirming the key role these deposits play in EU/EEA banks’ funding composition (see also their relevance in the previous chapter on funding). On the denominator side of the ratio, loans are the dominant component, comprising over three quarters of the total required stable funding.
4. Operational risks and resilience
Operational risk remains a key vulnerability for the EU/EEA banking sector and its infrastructure. The sector is increasingly targeted by cyber and hybrid threats, while its infrastructure and service providers remain vulnerable to operational dependencies that can propagate shocks across financial markets and their participants. Rising vulnerabilities associated with cybersecurity weaknesses and hybrid threats against the banking sector and its infrastructure are not least driven and amplified by an increasingly challenging geopolitical landscape, with heightened risk of state-sponsored malicious cyber activity.
Mounting operational risks put banks’ resilience to test
The weighted EU/EEA average of new operational risk gross losses was at ca. 0.9% of CET1 in 2025 and slightly decreased from ca. 1.0% in 2024[24]. Country-by-country data on operational risk losses in 2025 shows that losses are widely dispersed (Figure 33). While in six countries operational risk losses were at about 1% of CET1 capital or above, several jurisdictions reported relatively low loss amounts of less than 0.1% of CET1 capital. Operational risk events can result in substantial direct financial losses and reputational damage, potentially undermining confidence in banks. This may result in decreasing revenues if, for instance, a bank faces challenges to retain or attract customers. Costs might moreover increase because of materialising operational risk, when higher investments in compliance, governance, and technology, become necessary.
RAQ responses show a prominence of technology-driven operational risks from a risk scenario perspective, with close to 70% of banks identifying cyber risks and data security as the leading sources of operational risks. The rise of AI, and especially the emergence of highly capable frontier models (see Box 1 on AI-related developments), and quantum computing (see Box 2 on quantum-related developments) may moreover not only provide opportunities but also risks along the transformation path. A high dependency on ICT third-party service providers, such as cloud service providers, adds to risks.
While cyber risk remains a dominant operational risk, fraud risk continues to rise. It remains the second most significant contributor to operational risk, with a 58% consensus, the highest level recorded since it was first surveyed. It is not least also driven by rapid technological advances. RAQ responses identify conduct and legal risk as another significant contributor to operational risk, with a 48% consensus, and on a growing trend (Figure 34). Financial institutions and supervisors are also closely monitoring the risk of financial crime, including money laundering risk, and further conduct-related and legal risks to which they are exposed. The materialisation of such risks beyond those related to digitalisation can incur substantial litigation costs.
Reliance on third-party services providers poses challenges
Risks related to services contracted to third-party service providers remains high. These service providers are often domiciled in third countries outside the EU/EEA, which can limit the scope for monitoring and for adequate responses in the event of materialising risks. Results from the previous RAQ on non-EU/EEA dependencies have shown that banks consider ICT third-party-related dependencies as a major challenge. Given the widespread adoption of cloud computing across the banking sector, the potential impact and range of the associated risks have broadened considerably. AI model providers are also widely domiciled outside the EU/EEA (see Box 1 on AI-related risks and opportunities for banks). The observed simultaneous rise in fraud and third-party risks may additionally point to growing vulnerabilities associated with digitalisation and greater reliance on external third-party service providers[25].
Technology-driven fraud risk is on the rise
Fraud risk is predominantly external and its rise is driven by digitalisation and technology. Financial institutions identify compromised or stolen customer credentials / social engineering, payment fraud, and online and cyber-fraudulent activities emerging as the most relevant risk channels according to RAQ results. While AI-related fraud appears comparatively limited for the time being, rapid technological developments may widen the scope and sophistication of AI-related fraud opportunities. There are moreover some concerns that it might be underreported[26].
AI-related fraud could also amplify existing fraud channels and enhance their sophistication. This could, for example, enable impersonation and social-engineering attacks on a larger scale, while making fraud attempts harder to detect. The European Union Agency for Cybersecurity (ENISA) has also observed a continued integration of AI into malicious cyber activities, including activities carried out by cybercriminal operators and state-nexus intrusion sets[27]. Payment services are also affected by increasing AI-driven fraud risk. Underlining the high relevance of fraud risk, many jurisdictions report strongly increasing fraud losses that consumers had to bear from credit transfers in 2025. Compared to 2024, these losses increased by more than 10% in 17 countries[28]. At the same time, growing use of AI may also improve anti-fraud measures (see Box 1 on other impact from AI usage at banks).
Cyber risk management gains ground as threats evolve
While the level of cyber threats remains high for the banking sector, RAQ responses indicate that the impact of cyber threats seems contained for now, and that cyber defence capabilities at banks may have improved. The responses indicate that the share of banks that had not been a victim of at least one cyberattack that resulted or could have potentially resulted in a ‘major ICT-related incident’ increased to 67% in the second half of 2026 and has steadily increased up from 42% in the first half of 2025[29]. Also, the share of banks that had been a victim of 11 or more cyberattacks in the second half of 2026 decreased to 5%, from 11% in the second half of 2025. RAQ responses also suggest that the share of responding banks not having faced a successful attack that resulted in an actual major ICT-related incident increased to 93% in the second half of 2025, from 78% in the last iteration of the RAQ. These figures indicate that amid an unabatedly high cyber threat level, banks currently appear to mitigate the impact of threats and to have improved their cyber defence capabilities. A decline in perceived IT-failure risk may additionally point to some operational resilience improvements. It nevertheless does not imply lower risk from steadily advancing technology.
ENISA confirms that the banking sector is among the five sectors experiencing most cyberattacks[30]. It confirms that the cyber threat landscape in Europe remains shaped by a combination of threats, including those driven by geopolitical developments, and by growing interconnectedness of digital ecosystems. Of the cyber incidents ENISA collects, the finance and banking sector was primarily impacted by unauthorised access (46%) and DDoS attacks (38.9%), followed by fraud and impersonation (14.8%). Member States reported to ENISA that 10% of incidents with a significant impact in 2025 impacted the banking sector. Cybercriminal, hacktivist and state-nexus threat groups increasingly rely on scalable techniques, shared tooling patterns and trusted digital environments to conduct their malicious activities.
System failures and external events are main causes for incidents
DORA requires effective management of ICT-related incidents, including their classification, management and dissemination. Since Digital Operational Resilience Act (DORA) related incident reporting commenced in January 2025, nearly 5 500 major ICT-related incidents from financial entities were reported to the EBA, excluding incidents that were subsequently reclassified as non-major (as of end September 2026). Banks reported over 4 000 major ICT-related incidents, making them the main driver for overall developments. The reported threats covered a range of scenarios, including distributed denial-of-service (DDoS) attacks, phishing campaigns, malicious websites, malware activities, and a third-party service provider breach. As regards the root causes of major incidents reported to the EBA in 2026 YtD, the majority of incidents credit institutions reported to the EBA were related to system failures and external events (Figure 35).
|
ESG reputational risk among EU banks fell slightly in 2025, but involved more banks
The number of ESG-related reputational risk incidents involving EU banks decreased from 391 in 2024 to 377 in 2025 and was 185 in the first six months of 2026. It decreased in environmental, social and cross-cutting aspects, but remained the same in governance-related incidents in 2025 compared to 2024[32]. The first six months of 2026 show a slight decrease in all aspects (less than half compared to both 2024 and 2025). However, the number of banks involved in those incidents increased in all aspects (from 111 in 2024 to 142 in 2025 and was 86 in the first half of 2026), which might be explained with higher scrutiny on ESG-related aspects in the EU. The share of banks in the financial sector in all ESG incidents decreased from 21.4% in 2024 to 14.3% in the first half of 2026 but remains small overall (less than 3% of all entitites), even though it has slightly increased from 2.5% in 2024 to 2.9% in the first half of 2026 (share across all industries; Figure 41). These numbers and developments related to ESG-related reputational risk, as well as those related to environment-related litigation risk (as covered in the separate text box), indicate that these risk areas remain a topic that banks need to take into account and address in their overall risk management. It should also be noted that, while there is a wider effect on banks due to climate change, this data does not include any other ESG-related aspects but is focused only on ESG-related reputational risk incidents.
Source: RepRisk[33]
|
5. Profitability
EU/EEA banks’ return on equity (RoE) increased to 11.3% in Q2 2026 from 10.7% one year ago, underscoring the sector’s enhanced earnings capacity (Figure 42). On a yearly comparison, EU/EEA banks’ rise in RoE was strongly supported by higher income generation, as the increase in NII (+64 bps) and net fee and commission income (+34 bps) more than offset the decline in net trading income (-20 bps) and the negative impact from rising impairments (-17 bps). Around two thirds of EU/EEA banks estimate their cost of equity (CoE) within the 8% to 12% range. However, compared to the previous results, the share of banks in this bucket declined slightly by 3 p.p., whereas the share of banks estimating their CoE at more than 12% increased by 4 p.p. This increase may reflect both higher interest rates and heightened risk perceptions, which could raise investors’ required returns.
Developments at country level were mixed, with substantial heterogeneity persisting across jurisdictions. Western European banks generally recorded stronger improvement in profitability YoY. Austrian banks recorded the biggest increase, with RoE increasing by 760 bps YoY to 16.8%. This increase was primarily driven by several non-recurring factors, including substantial write-backs on participations and the absence of negative effects recorded in the previous year. Furthermore, earnings benefited from the contribution of an acquired business. Other Western European banking sectors, including France, Germany, Belgium and the Netherlands, also reported higher profitability, albeit at a more moderate pace. The higher RoE was mainly supported by rising revenues across these economies over the period, which provided a favourable backdrop for banking sector performance. Revenue as a share of equity increased by 360 bps in Austria, 140 bps in France, 60 bps in Germany, 180 bps in Belgium, and 200 bps in the Netherlands. In Austria and Germany, the improvement in profitability was further reinforced by lower costs, with cost as a share of equity declining by 390 bps and 30 bps on a yearly basis, respectively, alongside the increase in revenues. On the other hand, most Eastern, Northern and Southern European countries reported a contraction in RoE on a yearly basis, which seems to be driven by an unfavourable combination of revenue and cost developments across some banking sectors. Poland provides the most prominent example, where a 200 bps decline in revenue as share of equity coincided with a 93 bps increase in cost as share of equity, ultimately leading to a 300 bps reduction in RoE (Figure 43).
NII supports earnings performance
Following a drop in Q3 last year, NII as a share of equity has constantly increased since then (Figure 44). This reflects a ca. 9% rise in EU/EEA banks’ NII between Q2 2025 and Q2 2026. This improvement was primarily driven by an increase in interest-earning assets, reflecting robust business volume growth (on the growth of loans and deposits, for example, see Chapters on Assets: volume and composition and Funding conditions and emerging pressures). The net interest margin (NIM) also contributed to the rise in NII, as it widened again from the beginning of 2026. This rebound was likely supported by the prevailing interest rate environment. Taking a broader view of the income structure, NII accounted for nearly two thirds of the EU banking sector’s total revenue in Q2 2026. A country-level analysis shows that NII was the largest source of income in 28 out of 30 European jurisdictions, while net fee and commission income represented the primary revenue component only in Liechtenstein and Lithuania (Figure 45).
The positive NIM trend in recent quarters has been supported by the stabilisation of lending rates, following the moderate downward adjustment observed since 2024. Whereas lending rates to NFCs gradually declined and converged towards those applied to households (HHs), the latter remained stable over the period (Figure 46). For deposit rates, after increasing markedly throughout 2023 and reaching a peak in mid-2024, they have gradually declined in line with the easing monetary policy environment. Nevertheless, deposit rates remain above those seen before 2022, standing at around 1.9% for non-financial corporations and 1.1% for households in Q2 2026[36].
Continued improvement in cost efficiency across EU/EEA banks
Total costs and expenses accounted for 23.6% of equity in Q2 2026, an increase of 14 bps from the same period a year earlier. This marked the third consecutive quarterly increase in a row since the end of 2025, following a period of cost savings recorded earlier by EU/EEA banks in 2025. Staff expenses remained the largest component of total costs, accounting for 10.3% of equity in Q2 2026. Nevertheless, their small but continued downward trend contributed to the ongoing improvement in banks’ cost efficiency. This might not least reflect the increasing automation of banking operations and the associated reduction in personnel costs across European banks. This momentum is also reflected in the RAQ results, according to which 95% of banks are aiming to increase automatisation and digitalisation. At the same time, more than half of the banks also point to planned staff cost reductions (Figure 47). Other administrative expenses show a stable trajectory and account for 7.8% of equity. Impairments represent 2.7% of equity, while provisions and other expenses, including taxes, stand at 0.3% and 2.4%, respectively. Supported by continued revenue growth and disciplined cost management, the cost-to-income ratio of the EU/EEA banking sector was 51.5% in Q2 2026, which is at the lower end of the last 10 years.
EU/EEA banks’ cost of risk remained broadly unchanged, compared with one year ago, at around 50 bps. While the cost of risk remained contained across most jurisdictions since last year, reflecting generally resilient asset quality, notable differences emerged between countries. Most banking sectors reported cost-of-risk ratios below 60 bps, indicating that provisioning needs remained moderate despite the uncertain macroeconomic environment (Figure 49). Higher levels were concentrated in a limited number of jurisdictions, most notably Romania and Spain with 160 bps and 110 bps, respectively, presumably driven by banks’ local business in the former case or – in contrast – by its international business exposure to jurisdictions with higher NII, as in the latter case.
Banks’ cost-of-risk expectations confirm banks’ positive stance on asset quality. Close to 50% of respondents estimate a cost of risk between 0 and 25 bps for the current financial year and a further around 40% between 25 and 50 bps. Only a limited share of banks expects materially higher credit costs, suggesting that the deterioration observed in some early-warning indicators is not currently expected to translate into a broad-based increase in credit losses (Figure 50).
Looking forward, EU/EEA banks place particular emphasis on fee and commission income and NII when asked how they aim to improve their profitability in the next 6 to 12 months. According to the RAQ results, 62% and 52% of banks, respectively, identify these two revenue streams as high priorities (Figure 51). Within the RAQ sample, the proportion of banks prioritising NII increased by more than 22 p.p. over the past year. At the same time, net fee and commission income retained its position as the primary revenue priority, highlighting the consistency of banks' strategic focus on this source of earnings.
Higher profitability and stronger valuations are supporting banks’ appetite for mergers and acquisitions (M&A). More than 60% of the banks covered suggested that they are considering M&A transactions. The percentage is slightly higher than in the previous survey. Acquisitions of credit institutions, business units and/or portfolios within the EU/EEA remain the most considered transaction type, with an increasing trend over the past few surveys reaching ca. 30%. This suggests continued interest in cross-border consolidation within the European banking sector. A significant share of banks also considers domestic credit institution acquisitions, while domestic business unit transactions have steadily declined to ca. 10%. At the same time, banks are showing an increasing interest in NBFIs and other financial service providers, with the share of respondents considering such transactions almost doubling from 11% to 20% over the past two years (Figure 52).
6. Capital and risk-weighted assets
Strong capital generation supports resilience as rising RWAs weigh on capital ratios
EU/EEA banks remained strongly capitalised, supported by robust organic capital generation. The total capital ratio stood at 20.2% in Q2 2026, down by 13 bps year-on-year. This reflected a 15 bps decline in the CET1 ratio to 16.2% and a 3 bps decline in the Tier 2 component, partly offset by a 6 bps increase in the AT1 component. AT1 and Tier 2 capital in total capital represented 4.1%, with a 1.5% share of AT1 and a 2.6% share of Tier 2 capital in total RWA. The leverage ratio decreased by 10 bps to 5.8%. CET1 capital increased by EUR 79 bn (+4.8%) to EUR 1.72 tn. Capital generation was partly offset by higher regulatory deductions: goodwill increased by EUR 14.7 bn, while other deductions rose by approximately EUR 3 bn. Despite the increase in CET1 capital, the CET1 ratio declined as growth in RWAs was stronger than for capital accumulation (Figure 53).
Capital headroom remains solid despite a modest narrowing
EU/EEA banks’ CET1 headroom above the overall capital requirement (OCR) and Pillar 2 Guidance (P2G) remained solid at 4.7% in Q2 2026, although it declined by 11 bps year-on-year[37]. The narrowing was due to a decrease in the CET1 ratio, partly offset by a 4 bps reduction in the combined OCR and P2G. The latter was mainly driven by a 16 bps decline in P2G, largely offset by a 11 bps increase in the countercyclical and systemic capital buffers (Figure 54).
The CBR increased mainly driven by institution-specific countercyclical capital buffers (CCyB), which rose by 8 bps on average YoY to 0.83% of total RWAs. Further increases are expected during the remainder of 2026 as previously announced CCyB decisions take effect[38]. The systemic risk buffer (SyRB) increased by 2 bps to 0.31%, while the buffer for systemically important institutions – corresponding to the higher of each bank’s other systemically important institutions (OSIIs) or global systemically important institutions (GSIIs) buffer – remained nearly stable at 1.14% (Figure 55).
Strong aggregate capital headroom masks significant differences across countries and banks
CET1 ratios and capital requirements continued to show significant cross-country dispersion. In Q2 2026, the CET1 requirement corresponding to the OCR plus P2G ranged from 9.5% for banks in Luxembourg to 16.7% for banks in Norway, while CET1 ratios ranged from 13.5% in Spain to 26.4% for banks in Cyprus (Figure 56)[39]. Dispersion of capital headroom also remained substantial across individual banks. While most EU/EEA banks maintained comfortable capital headroom, some operated with considerably narrower margins, potentially limiting their capacity to absorb losses and sustain lending under adverse macroeconomic conditions. Strong aggregate capital positions therefore warrant continued monitoring of vulnerabilities at individual institutions.
Corporate and retail portfolios drive credit risk RWA growth
Total RWAs increased by 5.8% year-on-year to EUR 10.7 tn in Q2 2026. Credit risk RWA accounted for most of the increase, rising by EUR 476 bn (5.9%) to EUR 8.5 tn. At country level, Germany and France recorded the largest absolute increases, approximately EUR 106 bn each, corresponding to growth of 9.4% and 4.3%, respectively. Credit risk RWA also increased by EUR 43 bn in the Netherlands and EUR 38 bn in Austria. Romania (33.7%), Lithuania (29.7%), and Estonia (21.7%) recorded the highest relative growth rates. Operational risk RWA recorded the strongest relative growth, increasing by EUR 94 bn (7.2%), while market risk RWAs rose by EUR 15 bn (3.8%). These increases were marginally offset by a EUR 3 bn (-0.8%) decline in RWAs for credit valuation adjustment (CVA) and other risks. Credit risk continued to dominate the RWA composition, accounting for 80% of the total, followed by operational risk (13%), market risk (4%) and CVA and other risks (3%) (Figure 57).
Credit risk exposures across selected exposure classes, excluding securitisation and equity, increased by 5.3% year-on-year to EUR 27.4 tn in Q2 2026. Corporate exposures recorded the largest absolute increase, rising by EUR 533 bn (+7.3%), followed by retail exposures, which increased by EUR 394 bn (+4.8%). Exposures to institutions grew by EUR 291 bn (14.9%), representing the strongest relative growth among the selected exposure classes. Exposures to central governments and central banks increased by EUR 128 bn (1.7%), while other exposures rose by EUR 35 bn (3.8%). RWA for the same exposure classes increased by 5.8% to EUR 7.6 tn[40]. Corporates and retail portfolios also accounted for most of the increase in RWAs, contributing EUR 236 bn and EUR 108 bn, respectively (Figure 58).
Risk-weight density edges up, with diverging trends across exposure classes
Risk-weight density for the selected credit risk exposure classes increased by 13 bps year-on-year to 27.6% in Q2 2026, reflecting a slightly faster growth in RWA than in exposures. For corporate exposures, risk-weight density declined by 43 bps to 50.1%, as exposure growth outpaced RWA growth. Retail risk-weight density remained broadly stable, increasing by 5 bps to 26.3%. The decline was more pronounced for exposures to institutions, where exposure growth of 14.9% exceeded RWA growth of 5.5%, thereby reducing risk-weight density by 30 bps to 14.6%. Conversely, RWA for exposures to central governments and central banks increased by 7.7%, exceeding exposure growth of 1.7%, lifting RW density by 24 bps to 4.4% (Figure 59).
Reported default probabilities decline, while loss given default trends diverge at internal ratings-based (IRB) users
Reported probabilities of default (PDs) under the IRB approach declined for both corporate and retail exposures over the last year (PD including defaulted exposures). The average PD for corporate exposures fell by 13 bps to 3.2% in Q2 2026, while that for retail exposures decreased by 16 bps to 2.7%. Given the asset quality trends described in Chapter 2.2, as well as the macroeconomic developments, a deterioration of PDs might have been expected. However, the PD not least reflects a long-run average of the past default rates, which means that a rather slight asset quality deterioration might not immediately be reflected in it. Furthermore, the relatively strong growth of lending – with new loans having a lower probability of default – might overcompensate for any potential negative effect from older loans that default, resulting in the improvement in PDs described here. Loss given default (LGD) developments were more mixed. The exposure-weighted average LGD for corporate exposures remained broadly stable, edging up by 9 bps to 32.8%, while for retail exposures it declined by 46 bps to 23% (Figure 60). Trends in PDs and LGDs were not uniform across countries, even though corporate PDs declined in most countries, with notable decreases of 68 bps in the Netherlands and 62 bps in Belgium. Retail PD developments were more mixed, with a decline of 23 bps in Denmark and increases of 16 bps in Germany and 12 bps in France. Corporate LGDs decreased by 265 bps in Spain and 199 bps in Austria but increased for instance by 54 bps in Denmark. Retail LGDs rose by 220 bps in Denmark and 126 bps in Belgium, while declining by 91 bps in the Netherlands.
7. Retail risk indicators
Article 9(1) of Regulation (EU) No 1093/2010 requires the EBA to develop retail risk indicators (RRIs) for the timely identification of potential consumer harm. For this purpose, the EBA is publishing a list of RRIs that covers a wide variety of different types of products in the EBA’s remit, such as mortgage credit, consumer credit and payment accounts. These indicators support the monitoring of EU/EEA banking markets by assessing risks of consumer detriment stemming from institutions’ misconduct and broader economic conditions[41]. They help the EBA and national authorities prioritise consumer protection supervision and regulation, while also providing useful insights for external stakeholders.
In this year’s exercise, eight new RRIs were introduced to provide a more comprehensive view of retail risk across the pre-contractual, early-warning and materialised-risk stages. The latest available RRI data show a deterioration in consumers’ access to mortgage credit between 2025 and 2026, an increase in the share of consumer credit NPLs, and a rise in both the volume and value of fraudulent credit transfers between 2024 and 2025, accompanied by a significant increase in fraud losses borne by users.
General retail risk indicator
To illustrate the general trend of retail risk, the EBA uses an indicator based on the change in the number of consumer complaints about the misconduct of financial institutions received by EU Member States from one year to the next. The number of customer complaints registered by each Member State can also illustrate the extent to which EU consumers are aware of the existence of the different complaints channels. This indicator is based on the data submitted by EU competent authorities and Financial Dispute Resolution Network (FIN-NET) members, which are the bodies responsible for the out-of-court settlement of consumer disputes in the EU[42].
It is important to note that the rules regarding complaints registration are not harmonised in the EU and, including differences in data sources and complaints registrations methods, that might affect the comparability of the number reported by the different Member States. Therefore, this indicator should be interpreted with caution and should not be used to draw robust conclusions regarding the relative level of consumer detriment across Member States. The analysis shows the change in the number of complaints for the years 2024 to 2025 (Figure 61). Only the Member States that reported data for the two years are displayed in the graph. Between [43] 2024 and 2025 the number of complaints reported remained consistent, with a drop of just 1%[44].
Mortgage credit and other consumer loans
Pre-contractual stage indicators
Concerning pre-contractual risk indicators related to mortgage credit and consumer loans, the EBA uses five different indicators. Four of these indicators are derived from the ECB BLS and compare consumer demand for mortgages and consumer loans with the share of rejected applications for these loans. Together, these indicators provide valuable insights into the accessibility of credit for EU consumers and help assess developments in retail lending conditions. However, as they are not available for all Member States, they provide an indication of overall trends in lending conditions across the EU rather than a fully representative picture.
Between 2025 and 2026, the weighted net percentage (WFNET) of demand for mortgages fell to -27%, while the share of rejected applications for loans to households for house purchases increased to 5%. Taken together, these developments suggest a deterioration in consumers’ access to mortgage credit (Figure 62a)[45]. For consumer loans, both demand and the share of rejected applications declined slightly between 2025 and 2026, falling to -2% and 10%, respectively[46]. Taken together, these developments do not point to a deterioration in consumers' access to credit, although they may reflect weaker demand for consumer borrowing (Figure 62b).
The EBA also uses an indicator provided by the World Bank data, namely the percentage of people aged 15+ who report borrowing any money from family, relatives or friends in the past year. As the World Bank updates this indicator only every three to four years, but the EBA publishes its RRIs on an annual basis, this RRI remains unchanged for several years. A higher figure may indicate that fewer people have access to loans from financial institutions, and thus, resort to borrowing from family, relatives or friends. A higher figure may also indicate that the costs of borrowing have increased, making it less affordable to use financial services. In 2021, on average 15% of people had borrowed money from family, relatives or friends across the EU/EEA, with more than 25% in Bulgaria, Greece and Romania, and less than 10% in Portugal and Italy (see also the figure in the EBA’s Risk Assessment Report from December last year).
Post-contractual – early-warning stage
To capture early-warning signals of financial stress among consumers holding mortgage and consumer credit, the EBA uses indicators from the ECB Household Finance and Consumption Survey (HFCS). The HFCS debt service-to-income ratio compares households’ total monthly debt repayments with their gross monthly income, while the debt-to-income ratio compares total household debt with gross annual income. Together, these indicators provide insights into the indebtedness and debt-servicing capacity of consumers. However, they are not available for all EU Member States and therefore provide an indication of overall trends in the indebtedness of EU consumers holding credit rather than a fully representative picture.
As the ECB update this indicator only every four years, but the EBA publishes its RRIs on an annual basis, this RRI remains unchanged for several years. Between 2021 and 2023, the euro area mortgage debt service-to-income ratio declined slightly (Figure 63), indicating that, overall, households with mortgage debt devoted a smaller share of their income to servicing their mortgages. This suggests a modest easing of debt repayment pressures.
Across all indebted households, the debt-to-income ratio declined by 2.9 percentage points to 66.0%, indicating that household debt grew more slowly than income (Figure 64). This suggests a moderate improvement in households’ debt sustainability and a reduction in financial vulnerability.
The debt service-to-income ratio declined from 12.8% to 12.5%, indicating that indebted households devoted a slightly smaller share of their income to debt repayments in 2023 than in 2021 (Figure 65). This points to a modest easing of debt servicing pressures.
Post-contractual – materialised risk stage
For mortgage credit and consumer loans, the EBA’s RRIs capture the materialised risks to consumers by measuring consumers’ ability to repay their loans. The share of loans with forbearance measures aims to also assess the access of consumers to forbearance measures. In general, a decrease of this ratio may indicate that consumers experience detriment because their access to forbearance measures is lower over time. However, it may also be the case that the indicator decreases because of the overall strength of the economy and fewer customers requiring forbearance measures or transitioning from a period in which higher levels of forbearance measures were needed to one in which fewer measures are necessary.
Between June 2025 and June 2026, the share of household loans subject to forbearance measures continued to decline across the EU/EEA, falling from 1.22% to 1.17% (see Figure 66), in line with the trend observed in previous years. However, the proportion increased in seven countries. France and Iceland recorded increases for the second consecutive year, while Lithuania experienced the largest increase, at 22%.
The share of non-performing loans collateralised by residential immovable property aims to measure whether consumers face difficulties in making their mortgage payments. In general, a decrease of this ratio indicates that consumers’ financial situation is improving. However, it may also be the case that, over time, the indicator could for instance decrease if banks change their business model and/or limit providing mortgage products to certain consumers, and/or dispose of such loans.
Between June 2025 and June 2026, the share of NPLs collateralised by immovable properties over all such loans decreased from 1.3% to 1.2% across the EU/EEA (Figure 67). The share of NPLs increased in seven countries, with the largest increases observed in Greece and Estonia. In both cases, these increases followed almost equivalent declines recorded between 2024 and 2025. In Germany, Belgium, Slovakia and the Netherlands, the share of NPLs increased for the second consecutive year.
Between June 2025 and June 2026, the share of NPLs related to consumer credit increased from 5.3% to 5.4%. The largest increases in the share of such NPLs were recorded in Norway and Latvia, albeit from two of the lowest levels in the EU/EEA, while the largest decreases were observed in Cyprus and Sweden (Figure 68; on deterioration of asset quality, including the NPL ratio and the Stage 2 ratio, see also Chapter on Asset quality)[47].
Payment and deposit accounts
Pre-contractual stage indicators
Concerning pre-contractual risk indicators linked to payment and deposit accounts, the EBA uses an indicator provided by the World Bank data, namely the percentage of people aged 15+ who have an account at a bank or another type of financial institution. As the World Bank updates this indicator only every three to four years, but the EBA publishes its RRIs on an annual basis, this RRI remains unchanged for several years. This indicator shows the percentage of people aged 15+ who report having an account at a bank or another type of financial institution or report personally using mobile money services in the past year.
The higher the figure, the higher the proportion of the adult population with access to the most basic financial service. The latest data available is for 2024 and shows that on average in the EU/EEA 94% of people had a bank account, which is 2% lower than in 2021. While in more than half of EU/EEA states the figure is close to 100%, in Romania, Bulgaria, Italy, Poland, Greece and Hungary it is below 90% (see also the figure in the EBA’s Risk Assessment Report from December last year).
Post-contractual – early-warning stage
For payment and deposit accounts, the EBA’s RRIs capture the risks to consumers by measuring the profitability of holding deposits. The percentage of deposit interest expenses paid by banks to households over total household deposits measures the costs of deposits that customers hold at banks, and, in turn, the benefit to consumers. In general, a decrease of this ratio would mean that ceteris paribus holding deposits is less profitable for consumers. On the other hand, an increase would mean that ceteris paribus consumers are benefiting more from holding their deposits at a bank.
Between June 2025 and June 2026, the ratio decreased from 1.3% to 1.1% (on the flattening of the decline of interest rates on HH deposits, see also Chapter on Profitability). The interest paid to consumers on deposits continued to decline across most Member States, extending the trend observed since 2024. The most pronounced decreases were recorded in Sweden, Denmark and Luxembourg, while increases were observed only in Hungary, Bulgaria and Czechia (Figure 69). Looking forward, amid rising interest rates, deposit rates are also expected to rise again (on yields and interest rates, see also Chapter on Macroeconomic environment and market sentiment).
Payment services
Pre-contractual stage indicators
Concerning pre-contractual risk indicators for mortgage credit and consumer loans the EBA uses an indicator provided by the World Bank data, namely the percentage of people aged 15+ who have an account at a bank or another type of financial institution, those who report having a debit or credit card, and those who report borrowing any money from family, relatives or friends in the past year. As the World Bank updates this indicator only every three to four years, but the EBA publishes its RRIs on an annual basis, this RRI remains unchanged for several years. This indicator shows the percentage of people aged 15+ who report having a debit or a credit card. The higher the figure, the higher the proportion of the adult population with access to such payment services. In 2024, on average, 90% of people aged 15+ had a debit or credit card in EU/EEA Member States, with close to 100% in many states in the north of the EU/EEA, and figures below 70% only in Romania (see also the figure in the EBA’s Risk Assessment Report from December last year).
Post-contractual – materialised risk stage[48]
For payment services, materialised risks to consumers are captured by measuring the ratio of fraudulent payments in general and the losses borne by consumers as a result of fraud in particular[49]. With regard to the former, the share of fraudulent card payments aims to measure the share of fraudulent transactions in the total volume and value of card payments. An increase of this ratio would indicate that consumers are more exposed to fraud in the context of their card payments. The value and volume of fraudulent payments have declined since 2024. In 2025, 0.01% of the volume of card payments in the EU/EEA were fraudulent. The highest volume is to be found in Liechtenstein at 0.03%, and it was below 0.01% for 15 Member States (see Figure 70). The value of fraudulent card payments compared with the total value of card payments was 0.03% in the EU/EEA; it was below 0.05% for all the Member States.
Another indicator is the share of fraudulent credit transfer transactions in the total volume of such payments. An increase of this ratio may indicate that consumers are more exposed to fraud in the context of their use of credit transfers. The value and volume of fraudulent credit transfer have gone up since 2024. In 2025, 0.003% of credit transfers in the EU/EEA were fraudulent; however, it stayed under 0.01% for all Member States, except for Malta where it was slightly above (Figure 71). The value of fraudulent credit transfers as a proportion of the value of all such transfers was 0.001% in the EU/EEA in 2025, with the highest value found in Slovenia, Estonia, Malta and Lithuania.
Furthermore, changes in the value of losses due to fraud that are borne by card payment services users are also monitored. From 2024 to 2025, the total value of losses from this type of payment slightly increased by 3% (Figure 72). The highest increases occurred in Cyprus, Estonia and Liechtenstein. However, the quality of the data underlying this particular indicator requires further improvements to arrive at robust conclusions and, thus, results should be interpreted carefully. France remains the country that declares the highest number of losses due to fraud; however, that amount decreased by 9% between 2024 and 2025.
Data shows a 39% increase during the past year in the value of losses due to fraud that are borne by the users of credit transfers, which is more than three times the increase from the year before. The increase seems to be driven mainly by a significant increase in losses in Member States where the overall level of losses is high, such as France, Belgium, Spain and Italy. Between 2024 and 2025, the greatest percentage increase occurred in Liechtenstein and Malta (Figure 73). However, akin to the caveat for Figure 72 above, the quality of the data underlying this particular indicator requires further improvements to arrive at robust conclusions and, thus, results should be interpreted carefully.
8. Considerations on mitigating measures to address risks and vulnerabilities for the banking sector
Ensure that geopolitical shocks are properly addressed in banks’ risk management. Banks should strengthen the integration of geopolitical risks into their stress testing, as well as scenario and strategic planning. The potential for simultaneous shocks across asset quality, liquidity, funding and operations underscores the importance of realistic scenarios and credible management actions.
Profitability should be used to reinforce the sustainability of business models. While profitability remains strong, banks should continue to assess the resilience of their earnings under less favourable interest rate, funding and credit conditions. Current earnings provide an opportunity to reinforce loss-absorbing capacity and finance necessary investments to not least improve operational resilience and digitalisation, while ensuring that distribution policies remain consistent with sustainable business models.
Balance-sheet growth should be supported by sound underwriting and effective management of concentration of exposures. The acceleration in lending warrants close monitoring, as risks associated with new lending may become visible only with a time lag. Higher energy costs, inflation or weaker employment could strain borrowers’ repayment capacity, particularly among highly indebted households and corporates and those facing loan repricing. Rapid growth also calls for continued scrutiny of lending standards and borrower indebtedness, especially in unsecured credit.
Banks should support investments in sectors that are key to the resilience, competitiveness and sustainable growth of the EU/EEA economy. Sectors, including ICT, defence and energy, are paramount for this. Financing digitalisation, including AI and hyperscale infrastructure, should take due consideration of potential vulnerabilities associated with these evolving activities.
Look beyond stable aggregate NPL ratios to identify emerging credit weaknesses. Low NPL ratios should not obscure vulnerabilities, in particular, borrower segments or the effect of lending growth on the denominator. Banks and supervisors should monitor early arrears, Stage 2 migration, forbearance and default inflows, with particular attention to vulnerable SMEs, consumer lending and CRE exposures. Timely recognition of deterioration, adequate provisioning and early borrower engagement remain essential.
Strengthen the assessment of sovereign exposures and financial-sector interlinkages. Growing sovereign holdings warrant close monitoring of concentration, duration and valuation risks, including in portfolios measured at amortised cost. Increasing exposures to NBFIs require a comprehensive view of lending, securities, derivatives and contingent commitments, capturing leverage, common exposures and the possibility that counterparty distress generates simultaneous credit losses and liquidity demands.
Assess liquidity resilience beyond headline regulatory ratios. Banks should test their ability to withstand accelerated deposit withdrawals, margin calls, collateral haircuts and reduced market liquidity, including where several such events might occur at the same time. Particular attention should be paid to liquidity by significant currency, especially USD. Contingency plans should rely on operationally tested collateral mobilisation and realistic assumptions about asset sales.
Maintain diversified funding channels. Funding strategies should take into consideration concentrations by investor and instrument and reflect a balanced maturity and currency position. Banks should incorporate in these strategies potential higher refinancing costs and temporary market disruptions. Banks should maintain sufficient encumberable assets available for use as collateral to support access to secured funding and preserve future funding flexibility.
Operational resilience should also integrate preparedness for possible geopolitical shocks. Banks should prioritise remediation of critical ICT weaknesses, strengthen cyber defences and test their ability to sustain essential services during prolonged disruption. Exercises should capture the interaction between operational incidents, reputational damage and liquidity stress.
EU/EEA banks should also strengthen their response and recovery capabilities, amid rising AI-assisted cyber threat risks, with shortened time to detect and contain attacks. Threat-led penetration testing and scenario-based resilience exercises should assess preparedness for severe disruption and potential cascading effects across interconnected institutions. Amid the new threat landscape, banks also need to adopt new approaches such as AI-powered security testing and cooperation among each other for mutual information sharing related to AI-related and similar threats[50].
EU/EEA banks should adopt a risk-sensitive and transparent approach to AI development and deployment, supported by robust governance, clear accountability and effective human oversight. Strengthening data security and cyber resilience, alongside regular testing of AI systems, is essential to mitigate vulnerabilities, safeguard customer trust and meet regulatory expectations.
Reduce vulnerabilities arising from critical third-party dependencies. As banks increasingly rely on external providers for critical services, they should strengthen their assessment of dependencies, including those arising through subcontractors and shared infrastructure. Concentration among providers and the potential for system-wide disruption underscore the importance of tested continuity arrangements, credible exit strategies and coordinated supervisory monitoring.
Banks should begin preparing now for quantum-related security risks. They should identify vulnerable systems, third-party dependencies and data requiring long-term confidentiality, assess migration needs to post-quantum cryptography, and integrate quantum-related threats into their overall security planning.
EU/EEA banks should ensure proper identification of litigation risk and its integration into their risk management frameworks. This should include ESG-related litigation risks. Litigation risk identification should capture both direct legal and reputational risks and indirect effects through borrowers and counterparties. The potential for common exposures and sectoral spillovers underscores the importance of forward-looking monitoring and supervisory attention.
Abbreviations and acronyms
Annex 1: Sources of and basis for data and analysis
This report describes the main developments and trends in the EU/EEA banking sector and provides the EBA’s outlook on the related main risks and vulnerabilities[51]. The Risk Assessment Report (RAR) is based on qualitative and quantitative information collected by the EBA. The report’s key data sources are the following:
- EU/EEA supervisory reporting[52];
- the EBA Risk Assessment Questionnaire (RAQ) addressed to banks;
- market intelligence, as well as qualitative microprudential information.
This report follows the common structure of the EBA’s RARs. The RAR builds on the supervisory reporting data that competent authorities submit to the EBA on a quarterly basis, for a sample of 162 banks from 30 EEA countries (129 banks at the highest EU/EEA level of consolidation from 26 countries)[53]. Based on total assets, the sample covers more than 80% of the EU/EEA banking sector. In general, the risk indicators and other supervisory reporting-based charts and analysis are based on an unbalanced sample of banks, whereas charts related to the risk indicator numerator and denominator trends are based on a balanced sample[54]. When referring to countries, the respective data are based on the sample of banks applicable for this jurisdiction (see Annex 2), if not otherwise stated. The text and figures in this report refer to weighted average ratios unless otherwise indicated[55]. In selected cases, some of the analysis covered in this RAR is based on data from other reporting and data submissions, such as the EBA’s statistical data on fraud relating to different means of payment[56].
The RAQ is conducted by the EBA on a semi-annual basis, with one questionnaire addressed to banks[57]. Answers to the questionnaires were provided by 85 European banks (Annex 2) during August and September 2026. The report also analyses information gathered by the EBA from informal discussions as part of the regular risk assessments and ongoing dialogue on risks and vulnerabilities of the EU/EEA banking sector. The cut-off date for the market data presented in the RAR was 31 October 2026, unless otherwise indicated.
Annex 2: Sample of banks
List of banks that made up the sample population for supervisory reporting and the RAQ [58]:
[1] This RAR was prepared by and/or includes contributions from Achilleas Nicolaou, Aleksandra Potterie, Andreas Pfeil, Angel Monzon, Christoph Kuhn, Damiano Marcotti, Diana Vieira, Elia Tudisco, Fabien Le Tennier, Friedrich John, Gaetano Chionsini, Gloria Muraro, Jorge Pinto, Kamil Liberadzki, Katrin Johanson, Marcel Barmeier, Maria Rocamora, Mathis Meyer, Matteo Barbieri, Oihan Iglesias Lamuedra, Raphael Kopp, Salvatore Corvasce, Selma Zambaux, Vaidotas Tamulenas.
[2] See the Macroeconomic projections from the European Central Bank, the OECD Economic Outlook Interim Report, and the World Economic Outlook, September and October 2026 .
[3] The IMF for instance also covered sovereign debt related risks, such as in their blog on how rising sovereign yields raise the fiscal stakes from October 2026, as well as in their Global Financial Stability Report from October 2026.
[4] See, for instance, the European Supervisory Authorities’ statement towards a consistent and risk-based approach for ICT risks from frontier AI models from July 2026, as well as the ESAs’ Autumn 2026 risk update from September 2026 and ESRB’s warning: of systemic cyber risks from frontier AI models from June 2026.
[5] See also the ESAs’ statement toward a consistent and risk-based approach for ICT risks from frontier AI models from July 2026.
[6] On dependencies more broadly, see also previous RAQ results, which are extensively covered in the ESAs’ Autumn 2026 risk update from September 2026.
[7] See also the CERT-EU recommendations in their blog ‘AI is changing the economics of vulnerability discovery. Defenders should adapt now’ from April 2026.
[8] See, for instance, Box A on the financing of the AI infrastructure boom in the Bank for International Settlements (BIS) Quarterly Review from March 2026. See also the Banco de España occasional paper on the financing of the AI investment boom from October 2026, which, for instance, covers rising maturities of respective bonds as well as the involvement of non-bank financial institutions (NBFIs) in respective financing.
[9] There is no separate reporting by EU/EEA banks of their AI exposures as such, for which reason Nomenclature of Economic Activities in the European Community (NACE) code-based supervisory reporting data is used for this analysis, considering sector J (information and communication) non-trading loans. In case of data centre financing parts of the related exposures might for instance also be reported under NACE code L (real estate activities), not least depending on the project and financing structure. Besides the analysis in Chapter 2.1, see also the NACE code specific data in the EBA’s Risk Dashboard, with data of sectoral exposures and related NPL ratios in the Dashboard’s statistical annex. On potential data centre exposure, see the EBA’s risk assessment report from November 2024, Figure 13, on the distribution of CRE exposures, which indicates that data centres had a rather small share in CRE exposures those days.
[10] See, for instance, the reference to the relevance of digitalisation and advanced technologies in the so-called Draghi report on EU competitiveness from September 2024 (Parts A and B).
[11] Developments in SME lending are discussed in greater detail in the dedicated analysis on EBA SME lending note (EBA, November 2026).
[12] See the ECB’s Euro area BLS from July 2026.
[13] On private credit funds interlinkages, see also a separate textbox in the last edition of the EBA’s Risk Assessment Report covering this topic.
[14] The simplified analysis does not account for any potential hedging arrangements or other mitigating effects.
[15] For the purpose of this analysis, Eastern European countries include Bulgaria, Czechia, Hungary, Poland, Romania and the Slovak Republic. Nordic European countries include Denmark, Estonia, Finland, Iceland, Ireland, Latvia, Lithuania, Norway and Sweden. Southern European countries include Croatia, Cyprus, Greece, Italy, Malta, Portugal, Slovenia and Spain. Western European countries include Austria, Belgium, France, Germany, Luxembourg and the Netherlands.
[16] See, for instance, the ECB Working Paper about ‘stressed interbank markets: evidence from the European financial and sovereign debt crisis’ (2016) or from Tilburg University on ‘The Transmission of Non-Banking Liquidity Shocks to the Banking Sector’ (2024), which also includes interlinkages with NBFIs and the impact on interbank funding.
[17] See the last edition of the EBA Risk Assessment Report with an analysis of covered bonds in crisis times.
[18] Based on IHS Markit iBoxx data the average spread differential between senior preferred and covered bonds (asset swap (ASW) based) was around 41 bps in 2024, 33 bps in 2025 and YtD 32 bps.
[19] With regards to IHS Markit in this chart, and any further references to it in this report and related products, neither Markit Group Limited (‘Markit’), its affiliates, nor any third-party data provider make(s) any warranty, express or implied, as to the accuracy, completeness or timeliness of the data contained herewith, nor as to the results to be obtained by recipients of the data. Neither Markit, its affiliates, nor any data provider shall in any way be liable to any recipient of the data for any inaccuracies, errors or omissions in the Markit data, regardless of cause, or for any damages (whether direct or indirect) resulting therefrom.
[20] Note: The future paths of monetary policy portfolios and credit operations are assumed to develop in line with the median expectations of analysts, as reported in the latest Survey of the ECB's Monetary Analysts.
[21] See previous editions of the EBA’s Risk Assessment Report on possible impacts from CBDC, and in particular in the EBA’s Risk Assessment Report from July 2024.
[22] There might also be interlinkages with possibly rising customers’ use of AI tools for investment decision making (see Box 1 covering impact channels of AI on EU/EEA banks).
[23] There is no explicit requirement for banks to maintain a USD LCR of at least 100%. However, Article 8(6) of Commission Delegated Regulation (EU) 2015/61 requires consistency between the currency composition of liquid assets and that of net liquidity outflows and allows competent authorities to restrict currency mismatches. Banks with a USD LCR below 100% may therefore be more reliant on access to foreign exchange markets, including the ability to swap liquidity raised against EUR-denominated HQLA into USD, particularly under stress.
[24] Gross losses do not take any recoveries into account.
[25] Aimed at addressing third-party risk, the EBA published its Guidelines on the management of third-party risk (see EBA Guidelines on the management of third-party risk, September 2026).
[26] See IMF working paper ‘The Rise of Cyber Events and Digital Fraud in the Financial Sector’, March 2026.
[27] See the ENISA Threat Landscape 2026, September 2026.
[28] In reaction to this development, the EBA in cooperation with the other European Supervisory Authorities have developed easy-to-understand consumer education sheets (December 2025) to raise awareness. In addition, the IMF and World Bank have issued key considerations for policymakers to address cyber-enabled fraud in the financial sector (See the Bangkok Blueprint for Fraud-Resilient Financial Services, October 2026). See also the EBA’s press release from December 2025.
[29] ‘Cyberattack’ relates to an ICT-related incident with a potentially high adverse impact on the network and information systems that support the critical functions of the financial entity (Article 3(8) and (14) of DORA).
[30] See the ENISA Threat Landscape 2026, September 2026.
[31] See NIS Cooperation Group. A Coordinated Implementation Roadmap for the Transition to Post-Quantum Cryptography (June 2025), and G7 CEG, Advancing a Coordinated Roadmap for the Transition to Post-Quantum Cryptography in the Financial Sector (January 2026).
[32] Cross-cutting pillar refers to several subtopics including sale of controversial products and services; supply chain issues; violation of national legislation and/or international standards. Data is from RepRisk, on which further explanations can be found in footnote 33.
[33] RepRisk is an ESG data provider that collects information on companies’ and infrastructure projects’ ESG and business conduct risk to support decision-making by investors, banks insurers and other corporates. It takes an outside-in approach to ESG by processing and analysing ESG data from various public sources and stakeholders (such as non-governmental organisations, regulators, press, social medial, think thanks and research firms) and by intentionally excluding company’s self-disclosures). RepRisk’s methodology is public.
[34] See Setzer, J., and Higham, C. (2026). Global Trends in Climate Change Litigation. London: Grantham Research Institute on Climate Change and the Environment, London School of Economics and Political Science.
[35] Regulatory frameworks now explicitly address these risks: the EBA Guidelines on the management of ESG risks require banks to assess and monitor impacts of ESG-related litigation as part of operational and reputational risk management, as well as the updated EBA Supervisory Review and Evaluation Process Guidelines integrates environmental litigation into prudential oversight.
[36] On the interest rate risk in the banking book (IRRBB) see also the last edition of the EBA’s Risk Assessment Report from June 2026, with a separate textbox on the impact of interest rate changes on NII and economic value of equity (EVE).
[37] The OCR equals Pillar 1, Pillar 2, and the combined buffer requirements (CBR). The capital headroom-related analysis is expressed in terms of CET1. Differences in the availability of AT1 and Tier 2 capital also affects banks’ effective CET1 headroom, because in case these instruments are not used to meet T1 and total capital ratios to the degree possible, the respective difference must be covered by CET1 capital (‘shortfall’). On the usage of the word ‘shortfall’, see also the EBA Single Rulebook questions and answers 2016_2552. Consideration of AT1 and T2 shortfalls in calculating minimum own funds (CET1) requirements will further reduce the CET1 headroom on average by around 36 bps at EU/EEA level.
[38] See the ESRB’s overview of current and pending CCyB rates.
[39] Consideration of AT1 and T2 shortfalls in calculating minimum own funds (CET1) requirements shows a reduction in the headroom by more than 1 p.p. in 17 countries, ranging from 0p.p. to 3, 9p.p. (country average). Although AT1s and T2s are generally less expensive than CET1 (i.e. CoE), the former may not be economically advantageous for smaller institutions. Given their smaller issuance volumes, these institutions may face higher liquidity premiums and be less able to exploit economies of scale in issuance-related costs, such as related fees and other expenses.
[40] Portfolios/segments are differently defined in financial reporting (FINREP), which forms the basis for the analysis in Chapter 2.1, and in common prudential reporting (COREP), which forms the basis for the analysis in this chapter. These different definitions of portfolios/segments are the reason that the respective data cannot be fully reconciled with each other. Furthermore, the concept of the carrying amount of loans differs from the concept of exposure amount. The latter, for instance, also includes loan commitments. Securitisations, such as significant risk transfers (SRTs), might also contribute to these differences.
[41] The EBA published the RRIs for the first time in 2022 and updates them annually, which will over time allow the presentation of helpful time series and trends. The indicators were selected by the EBA from an initial long list of 50 indicators, the suitability of each of which was assessed against criteria such as measurability, data availability, data accuracy, implementation cost, geographical representativeness, and actionability. An explanation of the methodology for the calculation of the RRIs, including related data limitations, can be found on the website. See the EBA Retail Risk Indicators.
[42] These data are collected by the EBA every two years.
[43] No data reported for Belgium, Romania, Denmark, the Netherlands and Sweden.
[44] Between 2024 and 2025 no data reported for Belgium, Romania, the Netherlands, Norway and Sweden.
[45] Using data available for the following EU countries: Austria, Belgium, Croatia, Cyprus, Estonia, Finland, France, Germany, Greece, Ireland, Italy, Latvia, Lithuania, Luxembourg, the Netherlands, Portugal, Slovenia and Spain.
[46] Using data available for the following EU countries: Austria, Belgium, Croatia, Cyprus, Estonia, Finland, France, Germany, Greece, Ireland, Italy, Latvia, Lithuania, Luxembourg, the Netherlands, Portugal, Slovenia and Spain.
[47] Liechtenstein’s data are not available for this year’s exercise.
[48] The Netherlands’ data are not available for this year’s exercise.
[49] The figures presented here are elaborated from statistical data on fraud relating to different means of payment that, in accordance with Article 96 of PSD2, are sent to the EBA and the ECB by the national competent authorities (NCAs) based on the fraud data reported by their respective providers of payment services – i.e. credit institutions, payment institutions, and electronic money institutions.
[50] See the ESAs’ Joint Committee Update on Risks and Vulnerabilities in the EU Financial System (Autumn 2026), from 23 September 2026. Cooperation among each other should ensure that there are no weak parts within the banking system, because one weak part can be a threat for the whole system.
[51] With this report, the EBA discharges its responsibility to monitor and assess market developments and provides information to other EU institutions and the general public, pursuant to Regulation (EU) No 1093/2010 of the European Parliament and of the Council of 24 November 2010 establishing a European Supervisory Authority (European Banking Authority) and amended by Regulation (EU) No 1022/2013 of the European Parliament and of the Council of 22 October 2013.
[52] See the EBA’s information on supervisory reporting.
[53] Data as of the reporting date 30 June 2026 if not otherwise indicated. Supervisory reporting includes, for instance, prudential reporting (common reporting – COREP), financial reporting (FINREP). It must be noted that there are, partially, certain differences between reporting samples (on the sample of reporting banks, see Annex 2) and reporting requirements, such as in the level of consolidation.
[54] Being an unbalanced sample, the number of reporting banks per country may sometimes display certain variations between quarters, which might accordingly affect quarterly changes in absolute and relative figures and therefore changes in risk indicators for country-level aggregates must be read with caution.
[55] There might be slight differences between some of the risk indicators covered in the Q2 2026 version of the EBA Risk Dashboard and this report, as a result of data resubmissions by banks. The Annex to the Risk Dashboard also includes a description of the risk indicators covered in this report and their calculations, and further descriptions are available in the EBA’s guide to risk indicators.
[56] Respective payment related data is based on the latest payment data reported to the EBA and the ECB under Article 96(6) of Directive (EU) 2015/2366 (the revised Payment Services Directive, PSD2).
[57] The results of the RAQ are also published separately on a semi-annual basis. These published RAQ booklets (latest published version is from autumn 2026) also include explanations of the questionnaire and the analysis of the RAQ responses.
[58] The sample of banks is adjusted regularly to take into account bank-specific developments; for example, banks that ceased activity or underwent a significant restructuring process are not considered further. Not all banks are subject to all reporting requirements (e.g. those for FINREP, funding plan data). The list of banks that are the basis for the risk indicators refers to the sample of banks used to calculate the Q2 2026 indicators. The list of reporting institutions is available on the EBA website.