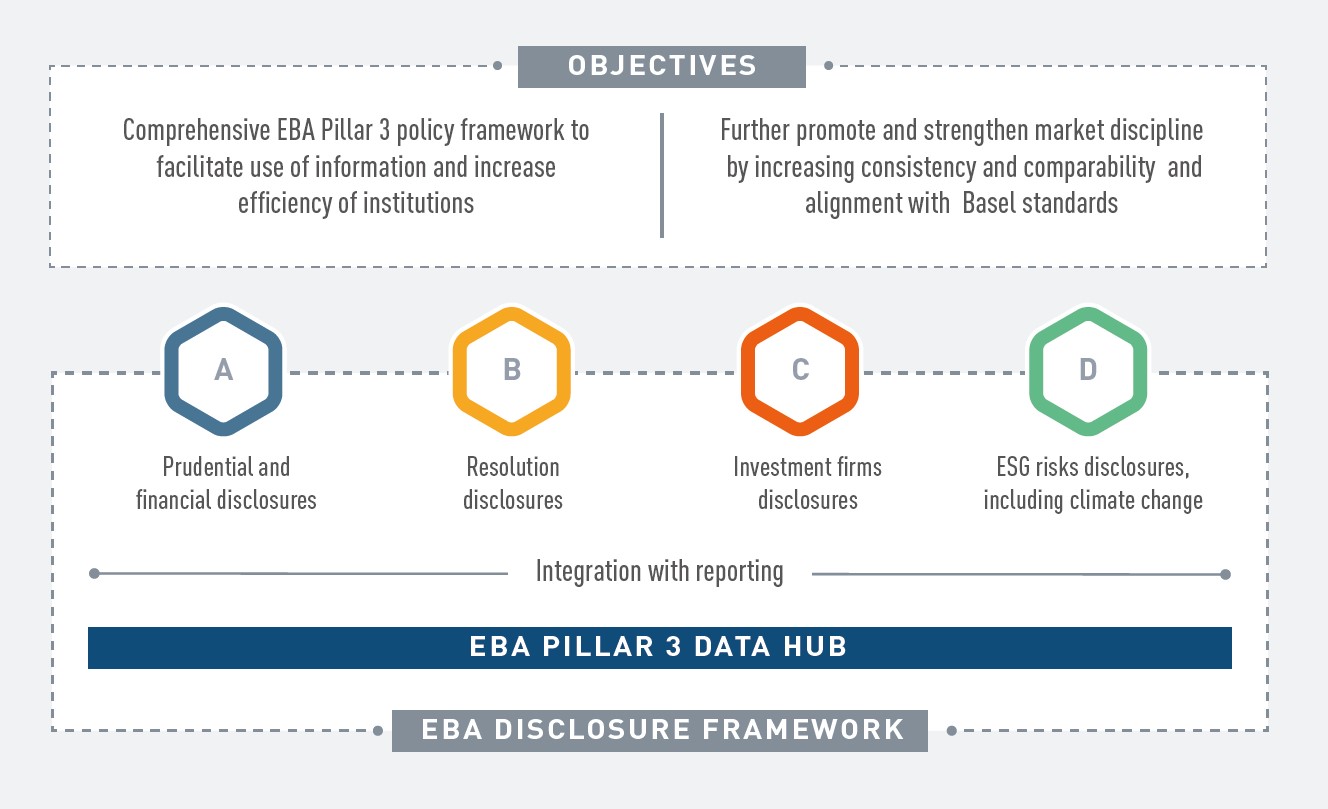
Media gallery Media gallery Infographic ESG disclosures for financial institutions (March 2021) Infographic Summary of ESG disclosures Pillar 3 Infographic Roadmap: collaborative approach towards Integrated Reporting Infographic Integrated Reporting system overview Infographic An Integrated Reporting System: high level features Infographic Investment firm reporting and disclosures overview Image EBA-2021.3792-2021-EU-wide-stress-test-infographics-reports.png Infographic The use of digital platforms in the EU banking and payments sector - Diagrammatic representation of Cluster 3 Infographic The use of digital platforms in the EU banking and payments sector - Indicative overview of digital platform clusters and enablers Infographic The use of digital platforms in the EU banking and payments sector - Diagrammatic representation of ‘enablers’ Infographic The use of digital platforms in the EU banking and payments sector - Diagrammatic representation of Cluster 4 Infographic The use of digital platforms in the EU banking and payments sector - Diagrammatic representation of Cluster 2 Infographic The use of digital platforms in the EU banking and payments sector - Diagrammatic representation of Cluster 1 EBA Official Photo EBA premises Infographic Overview of an integrated reporting system Infographic Common data dictionary main characteristics (integrated reporting) Infographic Main principles for building an integrated reporting system Infographic ESG disclosures in the EU - financial institutions Infographic EBA summary of ESG disclosures - Pillar 3 Infographic Joint Committee infographics_V2024.png Infographic EBA disclosure framework infographic Infographic Integrated reporting focus on Infographic Towards a new prudential framework for investment firms Infographic Infographic - ESG diclosures for financial institutions Pagination First page Previous page Page 1 Page 2 Current page 3 Page 4 Page 5 Next page Last page
Infographic The use of digital platforms in the EU banking and payments sector - Diagrammatic representation of Cluster 3
Infographic The use of digital platforms in the EU banking and payments sector - Indicative overview of digital platform clusters and enablers
Infographic The use of digital platforms in the EU banking and payments sector - Diagrammatic representation of ‘enablers’
Infographic The use of digital platforms in the EU banking and payments sector - Diagrammatic representation of Cluster 4
Infographic The use of digital platforms in the EU banking and payments sector - Diagrammatic representation of Cluster 2
Infographic The use of digital platforms in the EU banking and payments sector - Diagrammatic representation of Cluster 1
 Infographic